

Baseline Data (Tasks A2 and A3)
The purpose of the baseline is to provide the evidence base for the Sustainability Appraisal. Our review of the baseline data is divided into three sections – environmental, social and economic, to match how we have grouped our objectives and to fit the requirements of the appraisal process.
This version of the baseline was produced in August 2026.
Portrait of the North York Moors National Park
The North York Moors became a National Park on 28 November 1952 and is one of 15 in the UK. Another protected landscape (the 204 sq. km. Howardian Hills National Landscape) is joined to the National Park along the southern edge of the boundary, from Coxwold to Helmsley. The North York Moors National Park covers 554 square miles (1,436 km²) and has 26 miles of coastline. Around 96% of the National Park lies within North Yorkshire and 4% within Redcar & Cleveland local authority areas.
According to 2024 mid-year population estimates, the National Park is home to 23,223 residents who continue to contribute to the culture, communities, economy and upkeep of the National Park.
The main characteristic of the National Park is its deeply rural nature and absence of development. At just 0.16 residents per hectare, the North York Moors is the fifth least densely populated local planning authority area in England and Wales, after four other National Parks – Northumberland, Exmoor, the Yorkshire Dales and Snowdonia. Most of its settlements lie on its edges, and the more central areas are often very remote. The North York Moors National Park has one small town, Helmsley, which lies at the south western edge and is home to around 1,500 people. Around half of the town lies outside the National Park boundary in the North Yorkshire local planning authority area.
This relative paucity of development is reflected in transport links. There are no major trunk roads in the National Park. Two ‘A’ roads run along the eastern and southern edges - the A171 coastal route runs down the eastern edge of the National Park, linking Scarborough, Whitby and Guisborough and the A170 runs along the southern boundary from Thirsk to Scarborough, linking Helmsley and the villages at the foot of the Tabular Hills. The A174 then links Staithes and Whitby along the coast. Two roads then cross the National Park – the A169 which links Whitby and Pickering and the B1257 which links Helmsley and Stokesley, running through Bilsdale and Chop Gate. A Middlesbrough – Whitby train line also links villages through the Esk Valley including Castleton, Grosmont and Sleights and connects with the North Yorkshire Moors Railway which runs steam trains from Pickering to Whitby.
The National Park contains one of the largest expanses of heather moorland in England and Wales, covering over 44,000 hectares — around a third of the National Park's area. The highest point is Urra Moor (454m). There are 1,408 miles (2,268km) of Public Rights of Way, and the 109-mile Cleveland Way National Trail forms an upside-down horseshoe around the National Park between Helmsley and Filey.
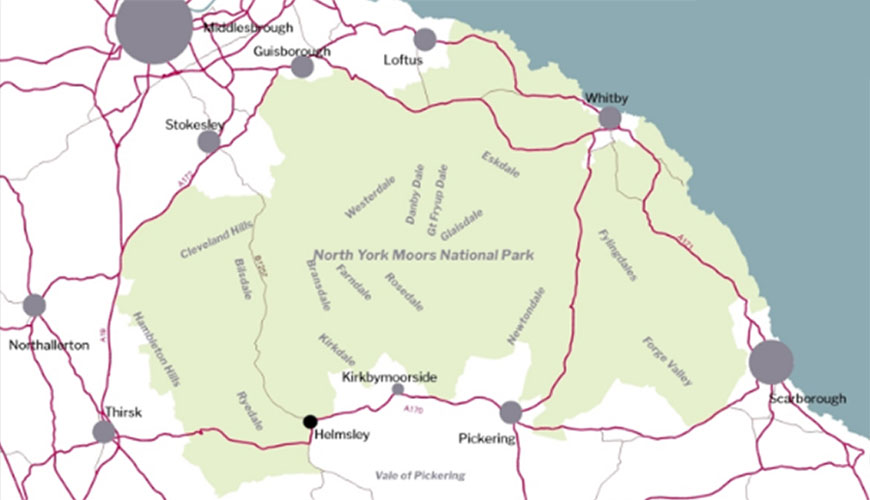
Contains Ordnance Survey data © Crown copyright and database right 2026
Environmental Issues
Landscape
Objective E1: To maintain and enhance the quality and character of the landscape of the North York Moors, including the special qualities of remoteness, tranquillity and dark night skies.
The landscape of the North York Moors was the primary reason for its designation as a National Park. The 1947 Hobhouse Report described the diversity of the landscape – ‘within a relatively small compass an amazing wealth of variety and beauty.’ The diverse and distinctive landscapes of the National Park have evolved through a combination of natural change and processes, human intervention and management. The uplands are characterised by the largest tract of open heather moorland in England and Wales, although other important landscapes and habitat types including river valleys, wetlands, coastal cliffs and rocky shores, forest and woodland, hedgerows and traditionally managed farmland are also features that contribute to the special qualities of the National Park. It is a varied yet unique collection of landscape types – from open heather moorland to intimate dales, dramatic sea cliffs, extensive woodland areas and prominent geological features such as Sutton Bank and Roseberry Topping.
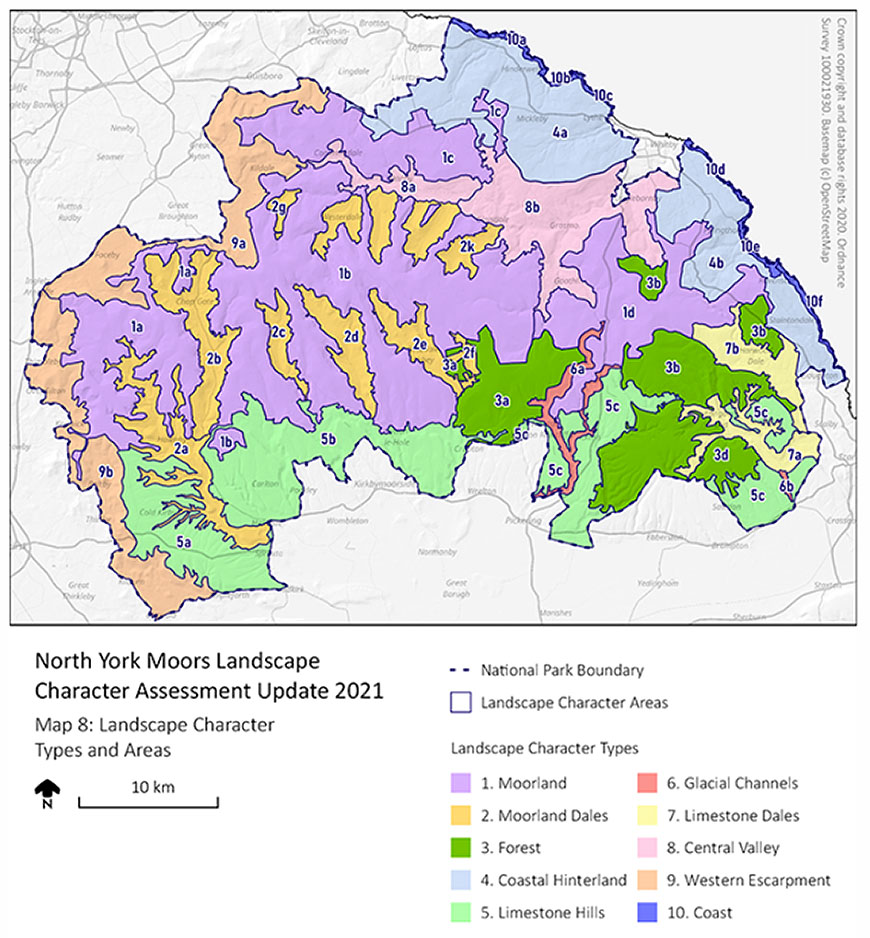
The North York Moors Landscape Character Assessment (2021) identifies 10 landscape character types and, within these, 38 landscape character areas. In summary, it describes much of the National Park, with the exception of an area of wider dales around the Esk Valley roughly attributable to Central Valley area, as having high landscape sensitivity to any form of change. The main landscape character areas are shown on on the map below.
Tranquillity
Tranquillity is one of the National Park's defining qualities and is repeatedly cited as something which both residents and visitors value. It has been identified through our 2022 Management Plan as one the ‘special qualities’ so valued by people with an interest in the North York Moors.
Tranquillity is not just about an absence of noise. It is about a feeling of peace, remoteness from man-made features. It is characterised by fresh air, stillness, wildlife and the ability to experience dark, star-filled skies. Tranquillity delivers an appreciation of, and connection with nature. It was perhaps best expressed by a member of the public who commented on a planning application in 2016:
“National Parks such as the North York Moors and beautiful quiet spaces such as Dalby Forest are now, and will become increasingly important for the physical and mental health of those who visit, to find tranquillity, a place where they can play, paddle, walk, run, cycle, ride and climb safely in beautiful quiet surroundings, to discover the wildlife and flora, to spend time away from all the ever-present noise and overcrowding of urban living and increasingly elusive work/school life balance”.
The map below, taken from CPRE tranquillity mapping published in 2007, shows that almost 90% of the National Park can be classed as relatively tranquil to a greater or lesser degree (where green is the most tranquil and red the least tranquil). Generally, the Park is more tranquil than the surrounding urban and sub-urban areas, with the open moorland being particularly tranquil. Areas of reduced tranquillity follow the roads and the fringes of the National Park, with the north east corner in particular featuring as less tranquil than other areas of the Park. Although the map is now relatively dated it is not considered that the overall picture it represents will have changed substantially over the intervening period.
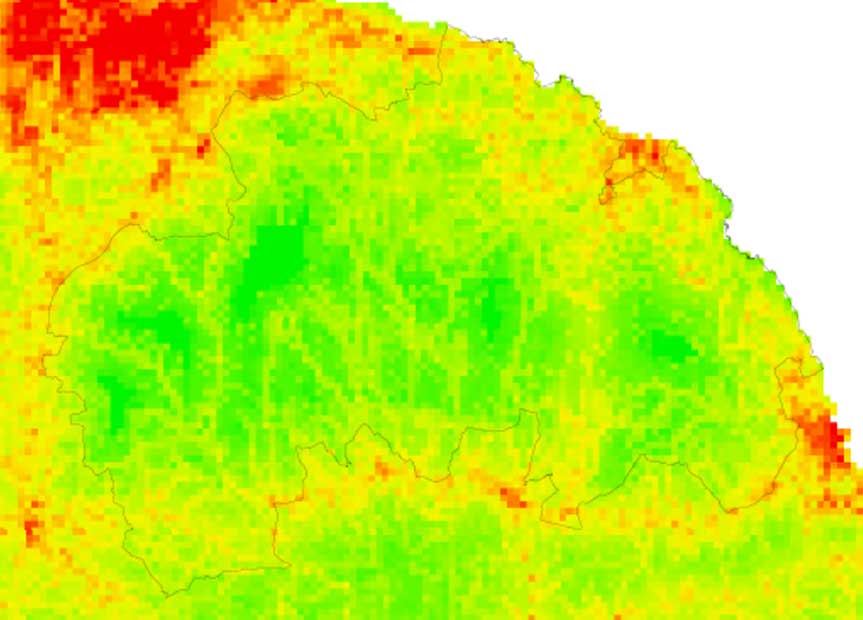
Factors contributing towards tranquillity include areas being free from human impact, native trees and woodland, running water and the ability to see stars at night. Factors in the National Park which detract from tranquillity are noise from vehicles and in the more ‘built up’ areas the concentration of people. The approach to which tourism facilities are planned for will therefore be a particular issue for the new Local Plan.
Dark Skies
The presence of dark skies makes an important contribution to perceptions of tranquillity. The increasing popularity of astronomy also helps bring people in to see what the North York Moors has to offer. A lack of major settlements and major roads mean that night skies in the North York Moors are especially dark, with Sutton Bank Visitor Centre and Dalby Forest recently being identified one of over a hundred Dark Sky Discovery Sites nationally. The National Park was designated as an International Dark Sky Reserve in 2020. Baseline mapping undertaken to support the designation indicates that the darkest skies lie within a ‘core area’ in the vicinity of Dalby and Cropton Forests, in the south east of the National Park. The regional position is illustrated by dark skies mapping work published by CPRE in 2016 (see map below). The National Park Authority’s Management Plan sets out an objective to increase the extent of the dark skies core area by 20%.
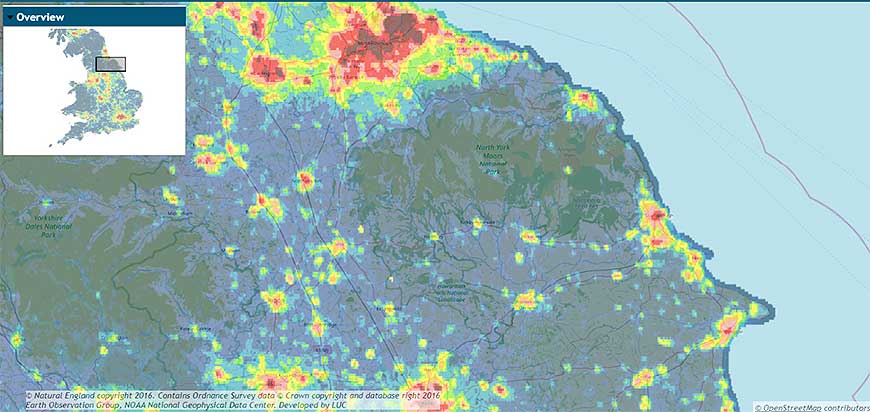
The dark skies ‘Core Area’ in the National Park is shown on the following map.
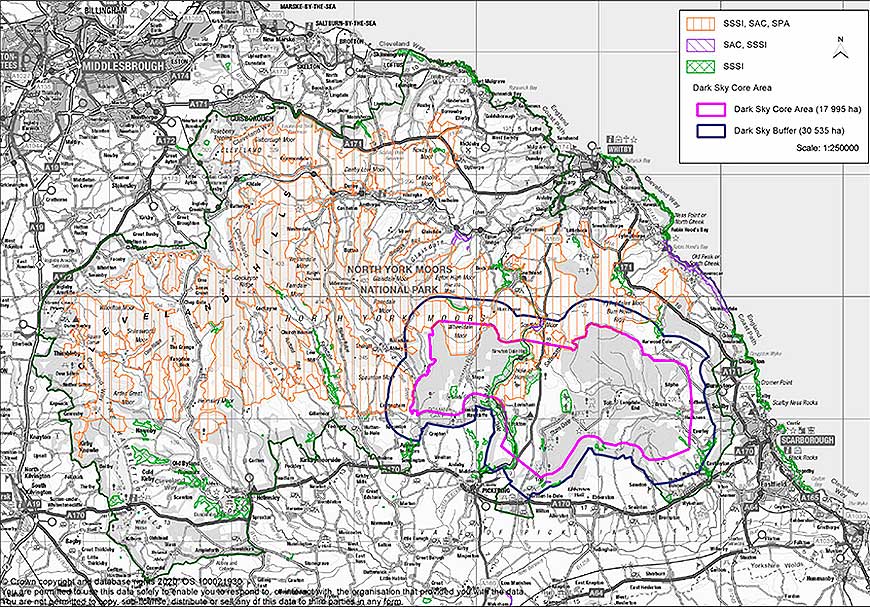
The new Local Plan can help preserve and enhance dark skies through the encouragement of sensitive new lighting in new development.
Key issues from the baseline:
The landscape of the North York Moors is highly valued and was the principal reason for its designation as a National Park. It is a significant natural resource that provides recreational, health and well-being benefits. It is also vulnerable to change, both from natural process but also from changes to the built environment. We need to continue to ensure that the landscape is maintained and enhanced, in line with our statutory duties set out in the 1995 Environment Act. The special qualities of the National Park also extend way beyond landscape. We need to continue to ensure that tranquillity, including dark skies and the National Park’s sense of remoteness, can be maintained or improved if possible.
Water, Soil and Air Quality
Objective E2: To protect and enhance water, soil and air quality, and reduce pollution, and improve efficiency of water use.
Water Quality
The waterways in the North York Moors have a wide range of characters: small becks creeping over moorland, swollen torrents thundering through deep wooded gorges, and slow waters quietly meandering through flat valleys. Most of the rivers flow over stone and gravel through firm, tree-lined banks. In some places the rivers lie low, between soft, sandy, easily eroded banks that slowly but steadily slip into the water.
The North York Moors are drained by three main river catchments, the Esk, Leven and Derwent. Most of the water in the north of the National Park flows into the River Esk which has its source high up on the moors above Westerdale and flows east to join the sea at Whitby. Water in the far north west of the National Park flows into the River Leven, which drops down to Great Ayton and then joins the River Tees. Water in the south of the National Park flows into the River Derwent. Its source is on Fylingdales Moor from where it flows south through Forge Valley and on to the Vale of Pickering, close to Scarborough. Before the last Ice Age, the Derwent flowed into the sea near Scarborough, but around 10,000 years ago a new route was carved by meltwater from glaciers. Now the Derwent turns west near Scarborough and then south to eventually join the Ouse near Goole. Several other rivers flow from the western moors and drain into the Derwent, including the Rivers Rye, Seph, Riccal, Dove and Seven, plus Hodge Beck and Pickering Beck.
Data on water quality is from the Environment Agency’s Water Framework Directive (WFD) Cycle 3 classifications of 2022 (Source: Natural England Protected Landscapes Targets and Outcomes Framework (PLTOF) data). Classification is not annual, and updated data is awaited from the Environment Agency (expected 2027). 31% of river length in the National Park is classified as ‘good’ (243 km out of 792 km). The overall figure for waterbody condition has been calculated by counting the number of waterbodies in each classification. Of all 95 waterbodies counted within the National Park (groundwater, lakes, transitional and coastal waters (TRAC) and waterbody catchments), 22.1% were classified as ‘good’, of which one was groundwater and 20 were waterbody catchments (which include rivers). 48.4% of waterbodies were classified as ‘moderate,’ 17.9% were ‘poor’ (3.2% were 'bad' and 8.4% have no status or were not assessed).
In August 2026, the Environment Agency (EA) published an Ecosystem Service Map Explorer (ESME) mapping tool. The EA states that this uses evidence on the condition of the water environment to model and map ecosystem service capacity (i.e. the potential to provide key ecosystem services). The tool currently covers natural and modified freshwater rivers across England and can be explored at 3 spatial scales: management catchment, river water body and river reach, based on national evidence available in 2025.
It currently covers ten ecosystem services: Provisioning services (Water Supply), Regulating services (Water Quality Regulation; Water Flow Regulation; Habitat & Species Population Maintenance), and Cultural services (Aesthetic & Amenity Experience; Recreation; Physical / Mental Health & Wellbeing; Education & Investigation; Spiritual, Cultural & Religious Experiences; and Intrinsic Value of Nature).
The ESME tool was not published in time to be considered during preparation of this version of the sustainability appraisal baseline but will be reviewed and relevant information incorporated into further iterations of the report.
Soil Quality
Soils are a vital ecosystem service – they are crucial as a form of carbon storage and they are vital to farming production. They are precious as they underpin our natural environment - soil health has a huge influence on the rest of our ecosystems. Vulnerability to loss of soil structure and runoff can lead to soil erosion and the carriage of pollutants into watercourses which therefore can have damaging effects on many of the ecosystem services that the North York Moors provide.
Soil is a complex natural resource and subject to much variation. Information on soils at a strategic scale is limited, and detailed soil analysis is resource intensive. There are two national soil classifications, the 31 soilscape categories which describe the type of soil (as available on the magic.gov.uk website) and the more detailed agricultural land classification system which separates the productivity of soil for farming purposes into six different classifications (Grades 1, 2, 3a, 3b, 4 and 5 plus non-agricultural/urban) with grades 1, 2 and 3a the most productive or ‘best and most versatile’ and subject to policy protection when it comes to major development. Strategic level mapping is limited to Grades 1 – 5 only and does not separate out grades 3a and 3b. Agricultural land classifications are also available on the magic.gov.uk website. No grade 1 or 2 land lies within the North York Moors and due to its upland nature the vast majority of the National Park is Grades 3 to 4. Consequently, there are therefore no major sustainability issues in terms of its quality as a food production resource within the National Park itself. However, it remains a highly important resource as a carbon sink, meaning peat restoration projects and agri-environment schemes aimed at soil retention will help to benefit a wider population.
In 2024, 50,780,625 tonnes of carbon was stored below ground (i.e. in soil) in the National Park (Source: Natural England PLTOF statistics). Well-managed soil stores more carbon, therefore an increase in below-ground storage over time can indicate an improvement in soil quality. Data on below-ground storage is only made available every 5 years.
Air Quality
One of the main features of the National Park is that it provides ‘space to breathe.’ The quality of the air across the National Park is a vital component in its attractiveness. Due to its remoteness and lack of strategic road connections or industry, the quality of the air is generally good.
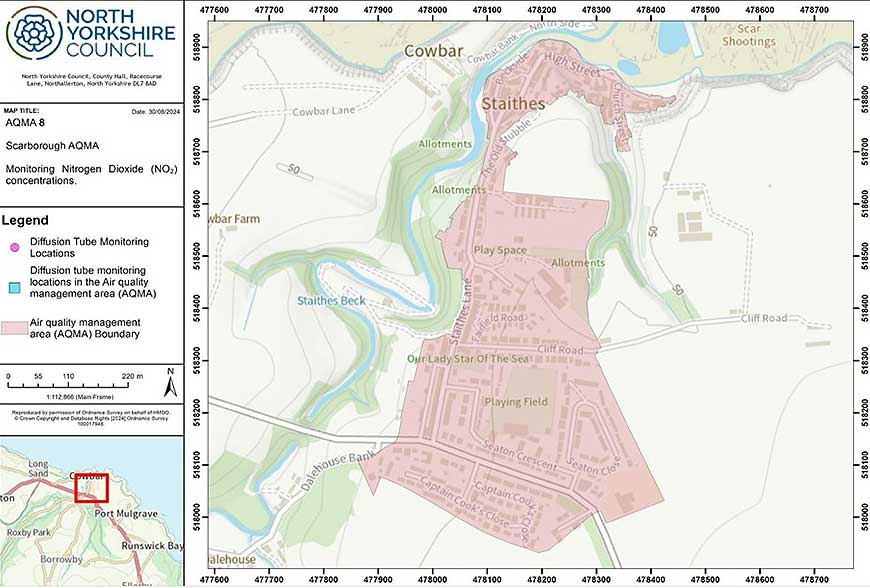
The Environment Act 1995 introduced a requirement for Air Quality Management Areas (AQMAs) to be declared where health based air quality objectives are not being met. Despite the generally good air quality within the National Park there is one AQMA, designated in 2018 in Staithes village as a result of particulate emissions from domestic heating. North Yorkshire Council, in its Air Quality Management Plan for 2026, indicates that this AQMA is to be retained for the time being, with further monitoring of air quality planned to be carried out. The report also notes that a significant proportion of particulates are considered to arise from natural sources (sea salt) but that the regulations do not allow these to be differentiated in the monitoring results.
Ozone levels and certain other air quality parameters have been measured continuously since 1987 at the air quality monitoring station at High Muffles, just inside the National Park near to Cropton Forest. These are recorded as part of DEFRA’s Annual and Exceedance Statistics. Ozone concentrations may occur a long distance from the source of the pollutants meaning that action to reduce concentrations must often be taken at a wider level. Ozone concentration can also be influenced by the weather with warmer spring weather tending to result in more exceedances. The large degree of variability generally reflects patterns for rural areas across the UK. Changes in the UK’s climate pose significant environmental, economic and social implications for the National Park directly and indirectly. It is however inherently difficult to accurately predict the exact effects of this change at a local level due to the complexities of the climate system.
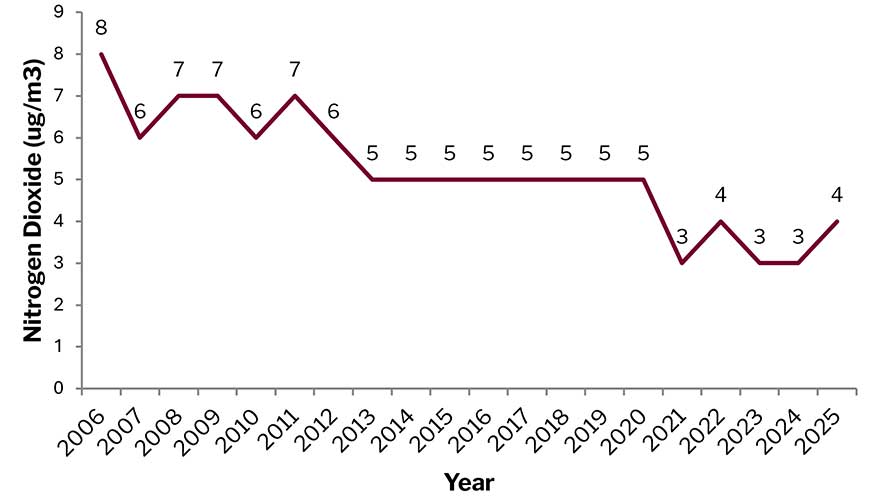
The trend for both ozone and nitrogen dioxide levels for this location over the past 10 years is summarised in the following chart. This shows a gradual reduction in levels of both these parameters over that period.
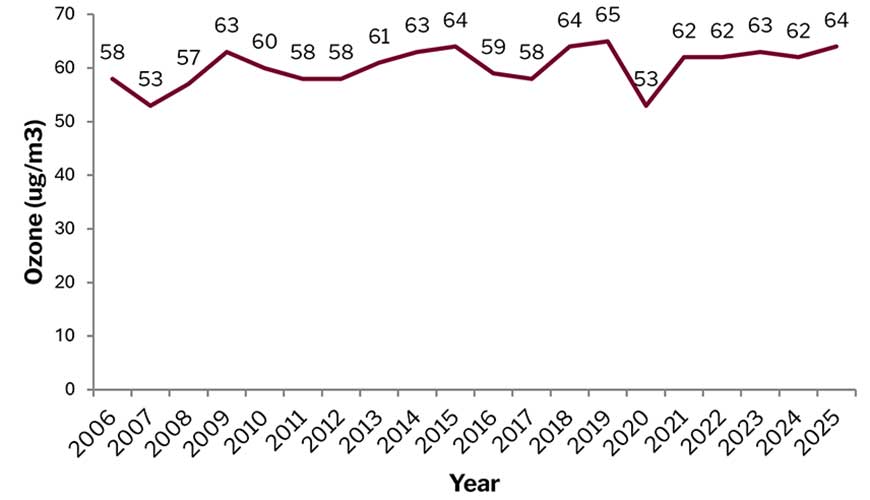
Two years — 2009 and 2020 — had annual data capture below the 90% threshold generally used for robust reporting (52.8% and 53.2% respectively) and should be regarded as indicative only.
For the High Muffles station, there have been no exceedances between 2006 and 2025.
For context, DEFRA also publishes annual air quality statistics for the UK. For ozone, the annual average maximum daily 8-hour mean concentration was 61 µg/m3 in 2006 and 68 µg/m3 in 2025, meaning that the High Muffles Station was recording levels slightly below the national average.
The effects of nitrogen and acidity in the air upon Special Areas of Conservation and Special Protection Areas are also monitored by the national Air Pollution Information System. This shows that critical loads are being exceeded in some instances, particularly in relation to nitrogen on the moorland and in wooded areas, with acidity levels also having an effect on blanket bogs and woodlands. Nitrogen emissions affecting the National Park are mostly attributable to livestock production and emissions from abroad, although shipping and road transport account for a small proportion of the emissions. Acidity can generally be attributed to emissions from power station and industrial uses in Yorkshire and the north east and to emissions from abroad. The impact of busy roads in close proximity to designated sites and impacts from agricultural sources such as slurry, manure and pig and poultry units can also be an issue.
Key issues from the baseline:
- Water quality in the North York Moors National Park is very important as it supports a number of rare species;
- There have been some improvements in terms of the number of water bodies moving up from the poor to moderate quality categories, however the number in the high/good categories is declining. We therefore need to continue to ensure water quality is improved;
- Information on soil quality is limited. No grade 1 or 2 land (high quality for food/plant production) lies within the North York Moors and due to its upland nature the vast majority of the National Park is Grades 3 to 4. There are therefore no major sustainability issues in terms of its quality as a food production resource within the National Park itself. However, it remains a highly important resource as a carbon sink, meaning peat restoration projects and agri-environment schemes aimed at soil retention will help to benefit a wider population;
- Air quality in the National Park is relatively good. There have been some exceedances relating to ozone and particulate concentrations, however air quality is generally influenced by activities occurring outside of the National Park. We need to continue to ensure that air quality is maintained or improved.
Climate Change and Flood Risk
Climate Change and Flood Risk
Objective E3: To reduce the causes of climate change and ensure future development is resilient to the effects of climate change, including reducing the impact of flooding and coastal erosion and avoiding flood risk.
The new England Peat Map for peaty soil was published by Natural England in 2025. The peat depth and area estimates for the National Park are as follows:
| Depth (centimetres) | Area (hectares) | Percentage of the total National Park area |
|---|---|---|
| 10-30 | 28,668 | 19.9% |
| 30-40 | 11,274.7 | 7.8% |
| Over 40 | 21,110.9 | 14.6% |
| Total peaty soil | 61,053.9 | 42.4% |
Table 1 Estimated peat soil depths in the National Park (Natural England 2025)
Net emissions from peatland estimates have reduced from 2005 to 2024 (17.8 to 13.7 ktCO2e) (Source: Natural England PLTOF statistics) perhaps indicating that condition is improving over this time, since degraded peat releases carbon dioxide. The statistics do not yet cover 2025, so the impact of the Langdale Moor wildfire on emissions is unknown.
In 2024, 50,780,625 tonnes of carbon was stored below ground (i.e. in soil) in the National Park (Source: Natural England PLTOF statistics). Well-managed soil stores more carbon, therefore an increase in below-ground storage over time can indicate an improvement in soil quality. Whilst this figure helps illustrate the significance of soil as a store of carbon, more long-term data is needed to determine trends.
The latest Government estimates of greenhouse gas emissions for Protected Landscape areas in the UK were published in June 2026 and cover the period 2005 to 2024. The report notes that Protected Landscapes are more rural than many other areas of the country so have different characteristics when compared to most local areas. Relative to their size, they have lower levels of greenhouse gas emissions than more built-up areas. In 2024, average emissions per km2 were 0.2 ktCO2e across the National Parks. In comparison, the average emissions per km2 across all local authority areas in the UK in 2024 was 1.4 ktCO2e.
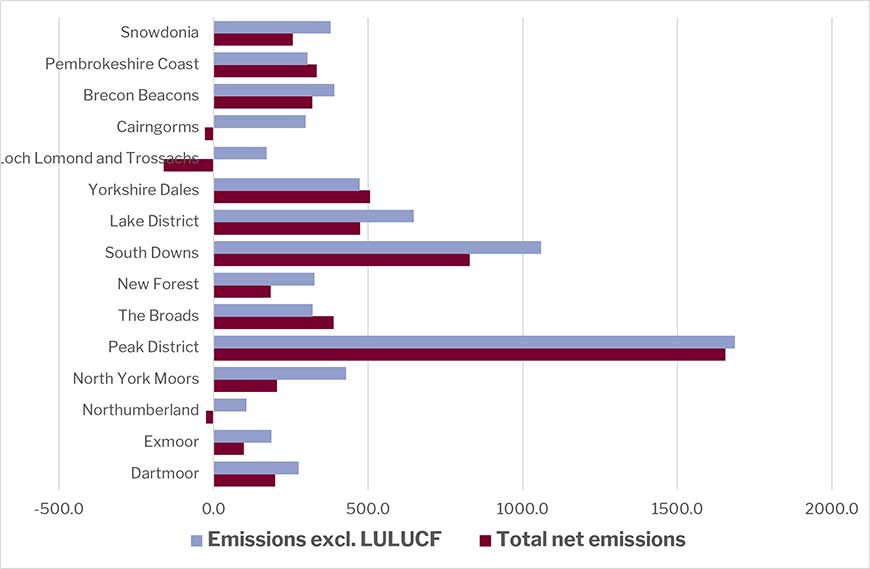
However, National Parks have higher emissions relative to the size of their populations, averaging 11.9 tCO2e per capita in 2024. Meanwhile, the UK average was 5.1 tCO2e per capita in 2024. The land use, land use change and forestry sector (LULUCF) is also more prominent in the emissions in Protected Landscapes, both as a source and as an emission sink in different areas. The following figure shows the net greenhouse gas emission totals in 2024 for the North York Moors National Park, in comparison with the 14 other National Parks, both including and excluding LULUCF.
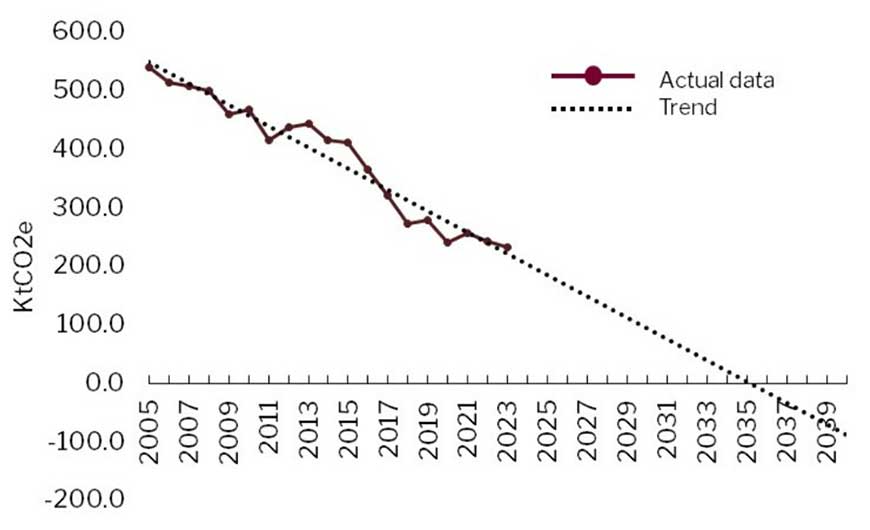
The data also shows that over the period since 2005 total estimated emissions from the National Park declined significantly from 552 to 205 kt CO2e. From 2005, territorial emissions from electricity use by the agriculture, domestic, industry, commercial and public sectors reduced 81% from 202 kt CO2e to 38 kt CO2e in 2023. In contrast, emissions from gas usage by the same sectors reduced by 41%, from 42 kt CO2e to 25 kt CO2e. The largest source of territorial emissions in the National Park in 2023 was agriculture (55%), followed by transport (23%), industry (10%) and domestic emissions (8%). Commercial, waste and public sector emissions comprised the remaining emissions (4%).
Livestock contributed to 73% of agriculture territorial emissions and soils contributed 15%. Both sources have decreased modestly from 2005 to 2023 (17% and 14%, respectively). In contrast, emissions from gas and electricity usage in agriculture have decreased dramatically by 97.5% and 99.6% respectively.
Changes in the UK’s climate have significant environmental, economic and social implications for the National Park directly and indirectly. Broadly, changes to the climate are likely to include drier, hotter summers and warmer wetter winters along with increasing numbers and severity of storms. In summary, it is considered that the main impacts of climate change on the North York Moors National Park are likely to be an increased risk of:
- Flooding of infrastructure (buildings, roads, footpaths) and habitats, having potentially significant consequences, including the financial impact of repair works and loss of business;
- Drought, affecting flora and fauna and also productivity, although real effects may not be seen until later in the century;
- Changes to the coastline as a result of a combination of sea level rise, increased rainfall and increased storminess;
- Increased risk of fire on the moorland. Whilst this may occur infrequently, the impacts can be catastrophic;
- Cumulative effects of a number of changes to conditions for agricultural production may lead to different types and/or new ways of managing crops and stock in the future;
- Cumulative effects of a number of changes to conditions for biodiversity may result in loss of some species and an increase / introduction of other, potentially threatening, species;
- Changing composition of native woodland, including tree species and ground flora, and economic implications in relation to timber production;
- Increased occurrences of disease affecting wildlife, trees, crops and livestock;
- Impacts on human health, particularly for the more vulnerable, as a result of increased heat stress.
In terms of flood risk, due to the upland nature of much of the National Park, flooding is not a major issue. However, there is a risk of flooding in some localised areas on the edge of the National Park. A Strategic Flood Risk Assessment (SFRA) was last carried out for the National Park area in 2017. Assessments will be updated as part of preparation of the new Local Plan should any development proposals potentially fall within areas of flood risk.
Flood risk mapping is also available from the Environment Agency. This looks at risk in terms of high, medium and low categories. Parts of the Church/High Street area of Helmsley are shown as having potential to flood, as are some small areas around the River Esk at Sleights and Ruswarp.
Key issues from the baseline:
- CO2 emissions from agriculture, roads and transport are particularly significant, as a proportion of total CO2 emissions;
- Trees, peat and woodland are valuable as carbon sinks;
- Climate change is predicted to have a range of potentially harmful effects on the National Park;
- There are very small pockets of areas at risk of flooding, and the moors are important for storing water and reducing flood risk downstream.
Given the relatively limited extent of flood risk areas within the National Park, flood risk is unlikely to present a significant strategic constraint on development. Nevertheless, site-specific flood risk considerations will remain important.
Biodiversity and geodiversity
Objective E4: To maintain and enhance conditions for biodiversity and geodiversity and avoid irreversible losses or damage to designated nature conservation sites, protected species and geological assets.
The diverse and distinctive landscapes of the National Park have evolved through a combination of natural change and processes, human intervention and management, and support a huge range of biodiversity and geodiversity, making it a magnet for a diverse range of wildlife and features of geological and geomorphological interest.
Within this wealth of biodiversity comes a number of land use constraints aimed at conserving such an important national resource. Over 44,000 hectares of central moorland of the National Park has been classified as a Special Protection Area (SPA) of international significance and 44,053 ha is designated Special Area of Conservation (including the SPA), again internationally important. Across the National Park a total of 47,260 hectares are designated as national Sites of Special Scientific Interest (SSSI), which equates to about 33% of its area. In 2024, 57 SSSI features (31%) were in favourable condition and in 2025 this had increased significantly to 76 (42%). There are also two National Nature Reserves (Duncombe Park just outside Helmsley and Forge Valley Woods west of Scarborough covering 171 hectares in area and Farndale Local Nature Reserve, covering 1 012 hectares. Finally, on a national scale, 42 km of the National Park boundary is coastline, of which 50.85 sq. km (3.54%) of the total area of the Park is designated Heritage Coast.
There are 22 SSSIs with geological features, containing a total of 34 monitored geological features. Runswick Bay, Robin Hood's Bay: Maw Wyke to Beast Cliff; Staithes-Port Mulgrave; Hayburn Wyke and Whitby-Saltwick are the coastal SSSIs with geological features. In 2026, 32 features were in favourable condition (94%) which is an improvement on 2024 where 27 (79.4%) were in favourable condition. In 2026, one feature was in unfavourable-recovering condition (and one was in unfavourable-declining condition).
The National Park also has 252.5 ha of Regionally Important Geological Sites (RIGS) in the part of the National Park in Redcar and Cleveland, equating to 0.18% of the total National Park area.
In 2022/23 it was estimated (source: Natural England PLTOF statistics) that woodland covered 29,939 hectares and comprised:
| Woodland type | Area (hectares) |
|---|---|
| Coniferous woodland | 14,817 |
| Broadleaved, mixed and yew woodland | 15,122 |
Table 2 Extent of woodland in the National Park 2022/3 (Natural England)
In 2024 the broadleaf and conifer woodland area was estimated to contain:
| Woodland type | Area in 2024 (hectares) | Difference from 2022 (hectares) |
|---|---|---|
| Broadleaved | 9,872 | 66 |
| Conifer | 12,529 | -503 |
| Mixed mainly broadleaved | 505 | 8 |
| Mixed mainly conifer | 584 | 27 |
Table 3 Extent of woodland in the National Park 2025 (Natural England)
The National Park has 6,296 ha of ancient woodland, of which 2,683 ha is ancient and semi-natural ancient woodland and 3,612 ha is plantations on ancient woodland sites. From 2022/23 to 2024/25, 350ha of new woodland has been created by the NYMNPA and partners.
In 2025, the Priority Habitats Inventory estimated that 53,217 hectares (36.9%) of the National Park was priority habitat. (Source: Natural England PLTOF statistics). The top five priority habitats by area were:
| Habitat type | Area in 2025 | Difference from 2024 |
|---|---|---|
| Upland heathland | 42,008 | -8 |
| Deciduous woodland | 9,262 | 137 |
| Wood pasture and parkland | 1,145 | Category not used previously |
| Blanket bog | 637 | 0 |
| Maritime cliff and slope | 487 | -5 |
Table 4 Extent of Priority Habitat in the National Park (Natural England 2025)
Other habitats in the National Park are also potentially important for conserving biodiversity. The estimated areas present are:
| Habitat type | Area in 2025 (hectares) | Difference from 2024 (hectares) |
|---|---|---|
| Grass moorland | 2,675 | -5 |
| No main habitat but additional habitats present | 1,476 | -37 |
| Good quality semi-improved grassland | 303 | -8 |
| Fragmented heath | 135 | 0 |
Table 5 Extent of other important habitat types in the National Park
There have been minor losses in the top five of the priority habitats (by area), apart from deciduous woodland which has increased. There have also been minor losses in other habitats that are important for biodiversity. However, more data is needed to see if this is a trend.
The moorland supports nationally important populations of breeding bird species. The Special Protection Area designation is based upon the presence of merlin and golden plover, which at the time of designation comprised around 3% of the national total. Data suggests that the populations here have fluctuated and no specific trends can be drawn out at this stage.
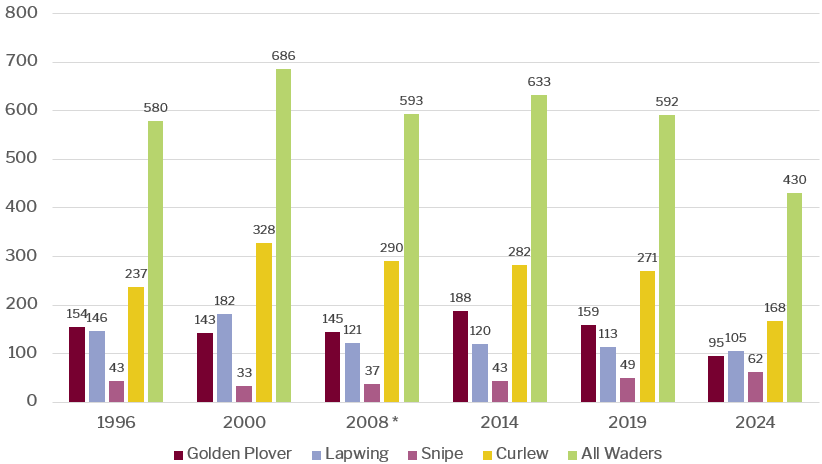
The Moorland Wader Survey is based on an in-depth survey, undertaken for the National Park Authority by Wold Ecology, from which the figures are extrapolated to represent the full area of moorland. It is carried out every 5 years. The purpose of the survey is to report on the breeding success of four wader species; Lapwing, Golden Plover, Curlew and Snipe. Populations of breeding moorland wading birds have tended to fluctuate over the past decade but with an overall decline in the population of breeding golden plover, lapwing and curlew, with snipe showing an increase. The reasons for these increases and declines may be due to normal population dynamics and as this is a snapshot survey, particular circumstances in any one year such as unusual weather conditions, can mask any underlying trend. The 2024 survey was undertaken on that very wet year, which is likely to have had some impact on the success of wader breeding in that year, so whilst the analysis does reflect a long term trend, the particular drop for golden plover and curlew is likely to be partially affected by this.
In 2024, 67,600 ha of land was in agri-environment schemes (Countryside Stewardship, Environmental Stewardship and Sustainable Farming Initiative), which was 58% of the registered area (total hectares of land parcels on the Rural Land Register) in the National Park (source: Natural England PLTOF statistics).
Key issues from the baseline:
- The National Park contains a wealth of both designated and non-designated habitats and many protected and non-protected species;
- The condition of our Sites of Special Scientific Interest has generally been improving over the past few years;
- There has been a large increase in the amount of land managed in line with conservation objectives since 1992 although this has decreased recently in line with national changes to agri-environment schemes;
- Woodland cover is increasing and the North York Moors has a high concentration of ancient woodland;
- Populations of some important moorland wader birds are declining, however populations fluctuate;
- Peat and soil health are of high significance in addressing climate change considerations.
Architectural, Archaeological and Cultural Heritage
Objective E5: To conserve and enhance the historic environment, heritage assets and their settings and to help facilitate opportunities for greater access to and understanding of the historic environment.
The National Park’s built environment is integral to the character and appearance of its landscape, much of which depends on the wealth of traditional and historic buildings and their interaction with the wider countryside. The landscape is characterised by many small scale buildings of traditional design often built with locally distinctive building materials. In addition, the pattern of development, siting and form of villages, hamlets and traditional farmsteads dispersed throughout the landscape reflects the social and economic history of the National Park and contributes to its special qualities.
Within the Park there are currently 42 Conservation Areas designated for their special architectural and historic character and appearance. The National Park contains approximately 3,000 Listed Buildings of which 35 are Grade I listed, 80 are Grade II* listed and the remainder Grade II listed. In addition, there are currently 839 Scheduled Monuments. Of these assets, in 2025 there were 45 listed on Historic England’s Heritage at Risk Register (41 Scheduled Monuments and 4 listed buildings (excluding grade II) (Source: Historic England Heritage at Risk Register 2025.) This represents the same number as in 2023 and 44 in 2024. There are a further 32 Grade II listed buildings on the Authority’s Buildings at Risk Register (2025/6 data). This represents a reduction over the past 5 years.
The National Park also contains four historic parks and gardens – Arncliffe Hall, Duncombe Park, Mulgrave Castle and Rievaulx Terrace and Temples. There are also numerous undesignated archaeological sites many of which are likely to be of national importance.
The key issues in respect of the architectural, archaeological and cultural heritage of the area are likely to arise in respect of the future development and land use within the National Park. Therefore, the Local Plan will need to protect and enhance the quality of the built environment by conserving and enhancing its heritage and ensuring that new development respects the context of these important sites and areas.
Key issues from the baseline:
There are a number of Scheduled Monuments and Listed Buildings ‘at risk’ although this has decreased slightly over recent years and measures are in place via the Authority’s Management Plan to bring about further improvements.
Natural Resources
Water Supply
Yorkshire Water estimated in 2025 that the average new household uses 140 litres of water per day (up from 120 litres in 2014). The area of the National Park around Whitby and the River Esk is supplied by river abstraction and springs in the Whitby area, the south east part of the National Park is supplied by boreholes which form the East Ground Water Zone and the south western area of the National Park is supplied by the Grid Surface Water Zone which is fed by reservoirs and rivers.
An updated Yorkshire Water Resource Management Plan (2024) forecasts there will be significant challenges in balancing future supply and demand for water over the area it supplies. These challenges include the impacts of climate change, population growth, reductions in supply to protect the environment and the loss of a water transfer currently received from a neighbouring water company. The Management Plan sets out goals to halve the volume of leaks on the network compared to levels recorded in 2017/18 by 2050; reduce customer water use to an average of 110 litres per head per day by 2050; work with retailers and business customers to achieve a 9% reduction in commercial water use by 2038, and; achieve a 20% reduction in water production per head of population by 2038.
A zone 1 groundwater ‘Source Protection Zone’ (SPZ) has been identified to the north of Pickering. Groundwater provides a third of drinking water in England and Wales, and it also maintains the flow in many rivers. The Environment Agency has defined Source Protection Zones (SPZs) for 2000 groundwater sources such as wells, boreholes and springs used for public drinking water supply. These zones show the risk of contamination from any activities that might cause pollution in the area.
Key issues from the baseline:
The likely increasing constraints on availability of water resources over the timeframe of the new North York Moors Local Plan means that this issue will require consideration in the development of new planning policy for the area.
Minerals
It is intended that the new Local Plan will include updated policies for minerals and waste, based on relevant policies currently contained in the adopted Joint Waste and Minerals Local Plan for North Yorkshire County Council, York City Council and the National Park Authority (2022). The North York Moors National Park Authority, whilst responsible for planning policy for minerals and waste is not the waste management authority, meaning it is not responsible for the collection, treatment and disposal of waste, which falls to the district and borough councils.
For context, the underlying geology of the southern area of the National Park is predominantly Jurassic limestone of the Corallian Group. The central, northern and coastal areas are largely made up of sandstone of the Jurassic Ravenscar Group. Relatively small amounts of sand and gravel deposits exist in river valleys towards the northern parts of the National Park. Small deposits of coal are found around central and northern parts of the National Park. A significant area of potash (polyhalite) and salt is also found at substantial depth below the surface of the northern and coastal parts of the National Park and there are known onshore gas resources in the south eastern part of the North York Moors and to a lesser extent to the north at Westerdale.
In recent decades surface minerals extraction within the National Park has focussed on limestone aggregate along its southern fringe (this has now ceased), along with small scale building stone extraction. Requirements for aggregate therefore need to be met from imports. Extraction of conventional onshore gas has taken place in the south of the National Park and there is current commercial interest in further development of these. Licences have been granted by Government for shale gas exploration and development, mainly within the southern and eastern parts of the area but there is a Government moratorium on any development of these using high volume hydraulic fracturing.
The largest active minerals operation is at Boulby Mine in the north east of the National Park, where the polyhalite form of potash is mined from, along with rock salt, from adjacent resources under the North Sea. It is the only potash mine in the country, producing approximately one million tonnes per year and employing around 500 people. Planning permission was granted in June 2015 for a second potash mine in the National Park at Doves Nest Farm, near Sneaton, Whitby. The scheme is for the extraction of up to 13m tonnes of polyhalite per year which would be transported to Teesside Port facilities by conveyor on a tunnel beneath the National Park. Construction of the Mine commenced in 2017 and is still in progress.
Waste and Recycling
Information on waste arisings and management is not generally available at National Park Authority level. Information collected as part of the evidence base for the Joint Minerals and Waste Local Plan 2022 indicates that, in 2014/5 an estimated 11,325 tons of waste was collected from households and recycling facilities across the National Park (a decline of 9% since 2008/9), of which 42% was recycled.[1] Most waste was dealt with within North Yorkshire. A further 6,915 tons of commercial and industrial waste was generated (figures relate to 2008 and are taken from Urban Vision and 4Resources, North Yorkshire Sub-region: Waste Arisings and Capacity Requirements Interim Report (2013)). There are eight household recycling sites within or close to the National Park (only Thornton-le-Dale and part of Whitby lie within) and a number of smaller recycling facilities (such as bottle banks) within the National Park. There are no active landfill sites within the National Park boundary.
Major developments outside the National Park boundary
In recent years proposals have come forward for a number of large scale development projects outside but relatively near to the National Park boundary, mainly in the Vale of Mowbray to the west. These include proposals for large energy storage facilities and solar farms. Incrementally there is potential for such development to impact on the setting of the National Park as a result of factors such as visual impact, loss of tranquillity and impact on dark night skies. The Vale of Mowbray also functions as an important wildlife corridor between the Yorkshire Dales and North York Moors National Parks.
Key Issues from the baseline:
- The Yorkshire Water supply area is expected to face a number of supply and demand related pressures over future years. Whilst the development constraints applying in the National Park mean that this may not be a major issue for the area, some further consideration will be required on how the Plan can contribute to sustainable management of water resources;
- There is a reliance on areas outside of the National Park for any aggregates used in the Park, reflecting the importance of National Park designation;
- A significant amount of potash and salt reserves are being exploited or may be exploited and these are of socio-economic significance;
- Onshore gas resources are of continuing commercial interest and will require consideration in updated policy for minerals;
- Waste is dealt with mainly outside the National Park boundary but there is a need for more up to date information on arisings and management routes;
- Pressure for major development outside the National Park could also have incremental impacts on the National Park and its setting, including related special qualities.
Re-use of previously developed sites
Objective E6. To re-use brownfield land and optimise the use of empty buildings and derelict sites bearing in mind their potential nature conservation and heritage value.
It is a policy objective to make the best use of brownfield land by using it in preference to greenfield sites. Whilst the rural nature of the North York Moors National Park means that there is no readily available supply of larger brownfield sites, there has historically been success in reusing existing buildings for new housing.
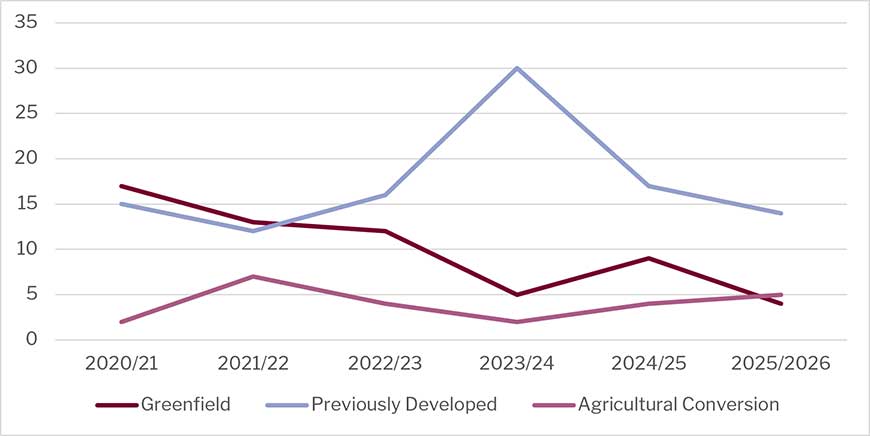
55% of completions over the past five years (2020/21 to 2025/26) were on previously developed land, 12% were conversions from agricultural buildings, and the remaining 34% were on greenfield sites. As with figures for earlier years, these figures should be treated with some caution as they may be influenced by the low sample sizes and the fact that a small number of greenfield developments on larger sites will be likely to outnumber development on the scarce brownfield land opportunities that exist.
| Year | Greenfield | Previously Developed | Agricultural Conversion |
|---|---|---|---|
| 2025/26 | 4 | 14 | 5 |
| 2024/25 | 9 | 17 | 4 |
| 2023/24 | 5 | 30 | 2 |
| 2022/23 | 12 | 16 | 4 |
| 2021/22 | 13 | 12 | 7 |
| 2020/21 | 17 | 15 | 2 |
Table 6 Housing completions 2020-2025 by previous land use
In Helmsley, the only town in the Plan area, the Helmsley Plan set out a target to deliver at least 150 new homes over the period of 2014 to 2027 through a mixture of committed sites, allocated sites and windfall developments.
To date (2020/21-2025/26), the Authority has granted 214 housing permissions in total. This includes 180 dwellings on the three allocated National Park sites, of which 77 units are affordable, together with 34 additional dwellings approved through windfall developments, conversions, and small infill schemes across the town. The permissions range from larger mixed-tenure schemes providing open market, affordable and extra-care accommodation to individual dwellings and building conversions. While all allocated housing sites within the National Park have now been built out, a number of smaller permissions remain at various stages of implementation.
Key issues from the baseline:
- 55% of completions over the past five years were on previously developed land and 34% on greenfield sites. There has been a relative reduction in greenfield completions over the past few years;
- The relatively limited number of development opportunities in the National Park may mean that proportions may vary over time, for example if a large site comes forward on a previously developed site this may skew any trend.
Social Issues
We identified the following social objectives:
Objective S1. To foster and maintain vibrant local communities and encourage a sense of community and belonging.
Objective S2. To provide decent housing in accessible locations to meet the needs of local people, including the young and elderly, and to maximise opportunities for provision of affordable housing.
Objective S3. To protect and enhance access to community facilities, leisure and recreation opportunities and access to the countryside.
Population
How many people live in the National Park and how old are they?
The 2021 census recorded a resident population for the National Park of 22,931, down from 23,380 in 2011, and 23,939 in 2001[1]. Over the following 10 years the population size remained more stable, with slight growth evident over the period 2018 to 2023. The most recent population estimates available is for 2024 when the population of the North York Moors was estimated at 23,233, with slightly more females than males.
The following graph shows the total population trend from 2001-2024.
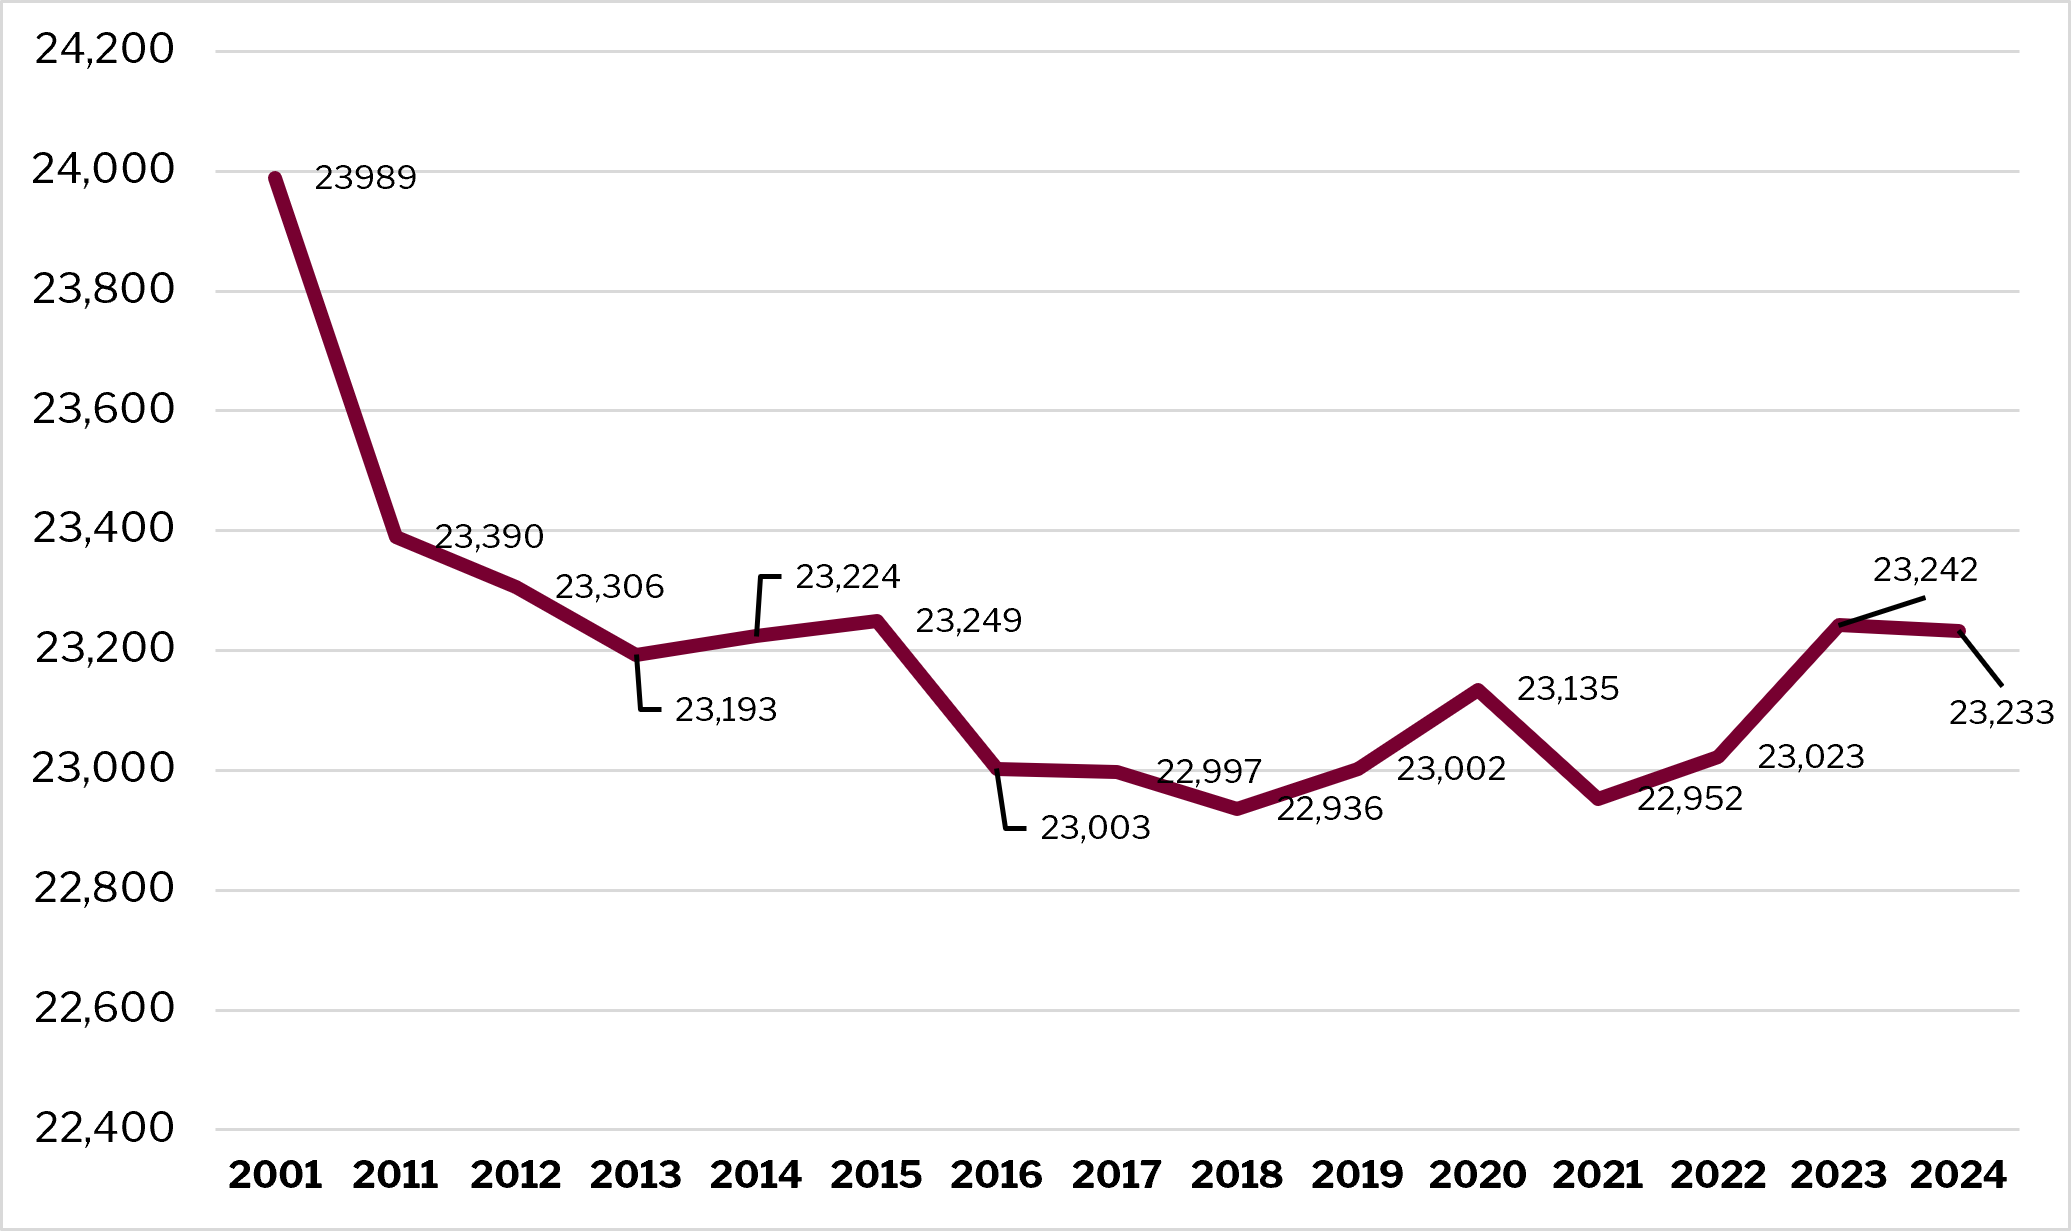 Figure 7 Population trends in the National Park 2001-2024 (ONS)
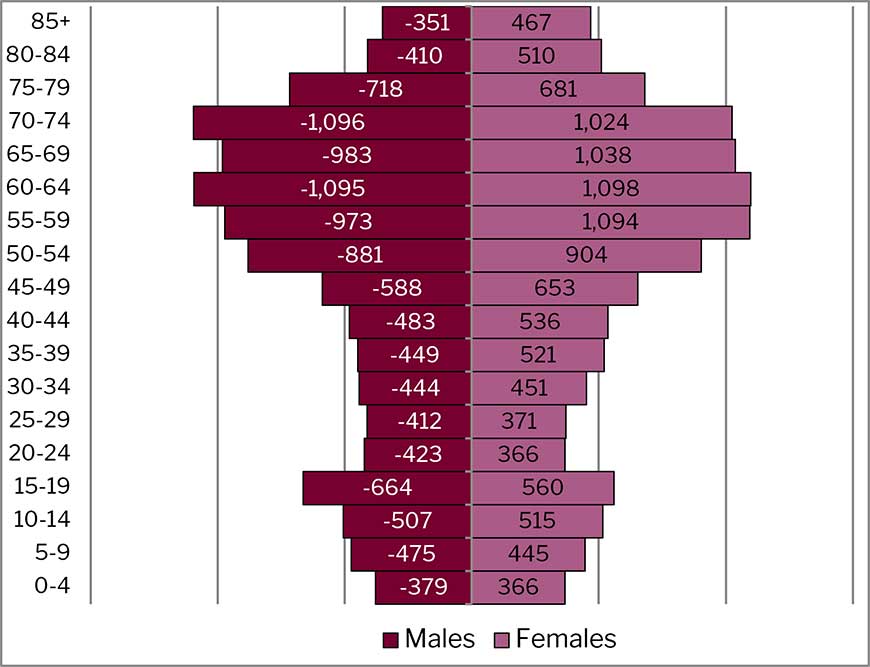
The following population pyramid shows the age distribution of our existing population. It shows that there is a particularly high proportion of the population aged 50-74, and correspondingly smaller proportion of young people and working age adults when compared with the position nationally.
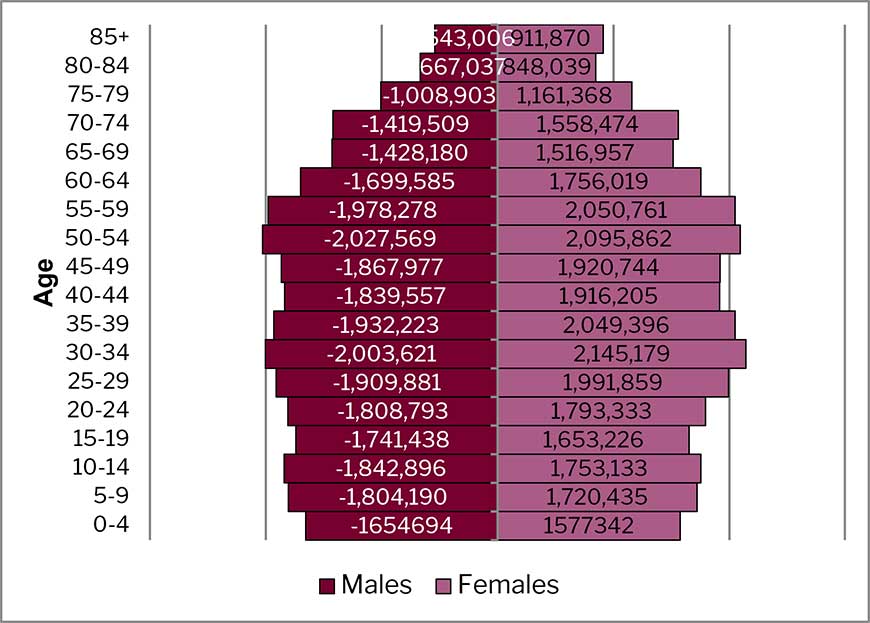
By comparison, the national distribution by age is shown on the following diagram.
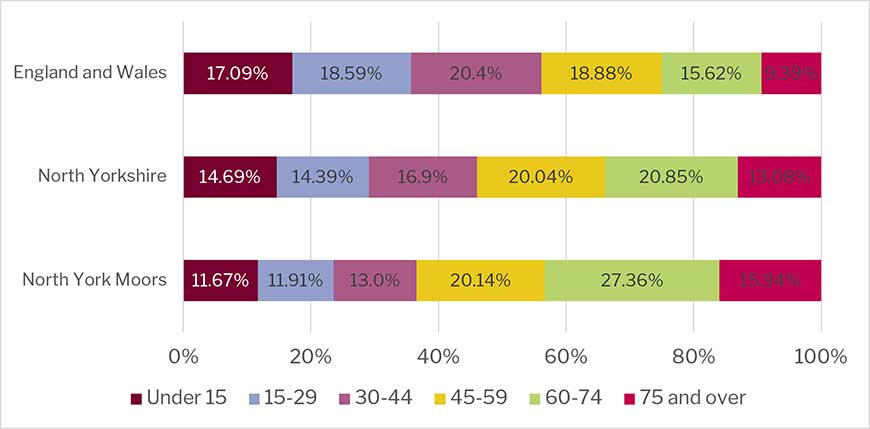
The next figure shows the population distribution in broad 15 year categories compared to the national, regional and county distributions. It demonstrates that the population in the NYMNP area is notably ‘older’ than other areas. Around 23% of the population of NYMNP is aged under 30 compared with 36% nationally. 43% of our population is also aged 60 or more compared with 24-25% across North Yorkshire and England.
A related issue is whether this population structure has changed over time. The chart below shows how the population of the National Park has changed its age structure between the 2001, 2011 and 2021 censuses. Of particular note is the decline in the working age population (a 7.5% drop of those aged between 15 and 64) and an increase in those over 65 over that period (11.5%). There is also a substantial decline in the younger population (0 to 14), suggesting that the trend of an increasingly ageing population is likely to continue.
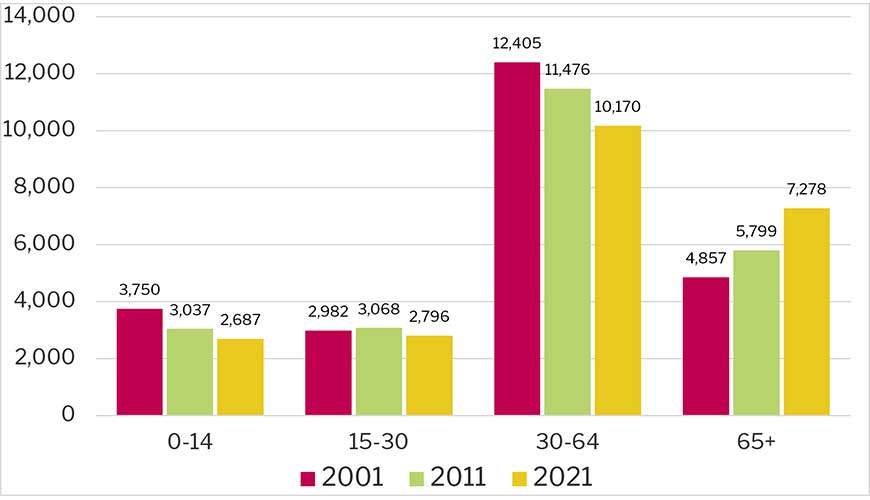
As with all statistics there is a need for care when looking at population trends, as the range of years chosen can affect the trend. Nevertheless, the data appears to show that the rate of loss of population within the 30 to 64 age range, and the rate of increase in the population aged 65 or more have grown over the successive 10 year periods 2001 to 2011 and 2011 to 2021.
In summary the main reason for these trends is people ageing over time, and in addition people who move into the area to retire and take advantage of the high quality environment that the National Park offers, rather than it being due to out migration of those aged 15-30. This inward migration is often characterised by more affluent people and those approaching retirement age, which tends to push up house prices.
Indices of Deprivation (IoD).
Indices of Deprivation cover Lower-layer Super Output Areas (LSOAs) (around 1,600 residents) and measure seven different types of deprivation:
- Income Deprivation
- Employment Deprivation
- Education, Skills and Training Deprivation
- Health and Disability Deprivation
- Crime Deprivation
- Barriers to Housing and Services Deprivation
- Living Environment Deprivation
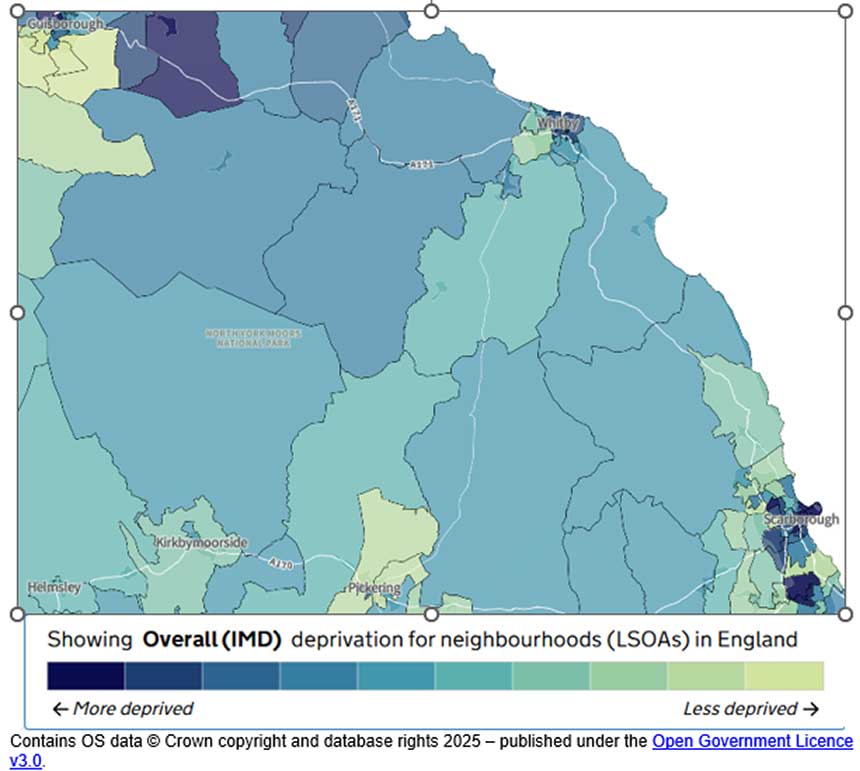
Output areas are sorted into ten deciles against the IMD, with 10% of the areas within each decile. The bottom three deciles are counted as the most deprived, Nationally 30% of areas will fall within these three deciles – the figure for the North York Moors (using ‘best fit data supplied by DEFRA) shows that 14.4% of the North York Moors population live in those three decile areas, meaning that levels of deprivation (as measured by the Index of Multiple Deprivation) are around half the national average. The areas around the former Hambleton Council area are less deprived than the national average, the former Ryedale area is a mix but is generally around the national average. There are significant levels of deprivation just outside the National Park boundaries in Scarborough, Whitby, Guisborough, the ‘East Cleveland’ villages (Skelton, Brotton, Loftus), and Stockton, Thornaby and Middlesbrough.
Key issues from the baseline:
- The population of the National Park declined noticeably over the period to 2016 but this loss appears to have stabilised for the time being. Nevertheless, the age structure of the population indicates an increasingly aging population and relative reduction in the size of the economically active age population;
- This ageing population and loss of younger economically active populations may have implications for economic prosperity in future;
- Progressive change to the age structure of the population may also have implications for future housing and community infrastructure needs within the National Park.
- Nearly all areas of the National Park score low on the deprivation index. There are, however, areas with significantly higher score just beyond its boundaries.
Households
How many and what types of households are there in the National Park?
Although there may be no environmental implications arising from a declining population how they occupy housing stock may reveal a different effect – do they need as much or more space? To examine this, we can look at the number of households in the National Park and how this may have changed. This is because the way people occupy houses may change over time – household sizes can rise and fall, meaning that a decline in population may not mean a decline in the need for housing, should the size of the average household be shrinking over time. This has been the case nationally as more people live alone; marry later, divorce and so on. According to the 2021 Census, there were 10,437 households (up from 10,342 in 2011), giving an average household size of 2.19 people, down from 2.25 in 2011. This means that despite a relatively stable population the demand for housing stock is actually increasing.
At 2021 the household split was as follows:
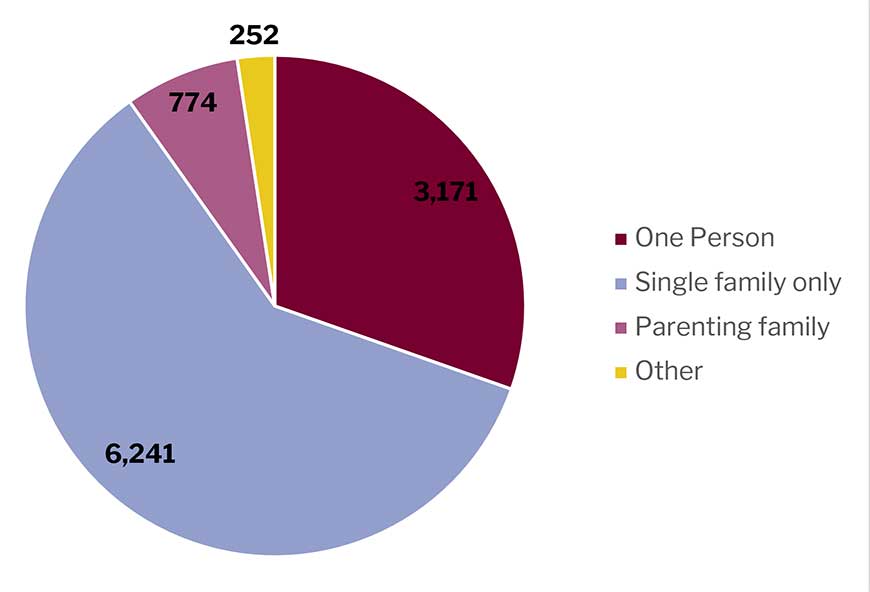
Of note, one person households made up 30.4% of all households, up from 29.5% in 2011 and 26.4% in 2001. We can also compare the composition of households against national and regional proportions. In a partnership includes married, same sex/civil partnership and cohabiting couples.
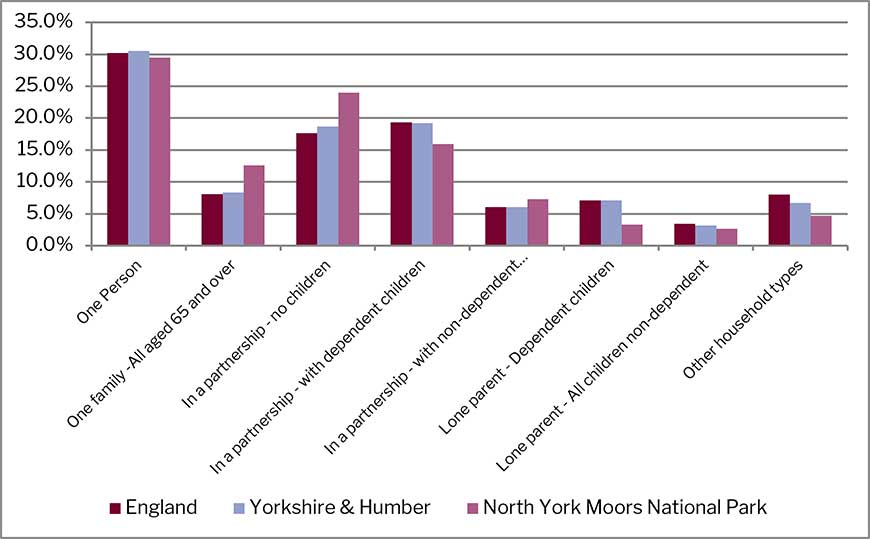
This shows we have a slightly lower proportion of one person households than regional and national figures, and comparatively fewer households in a partnership with no children (likely as the result of an older population whose children may have left home – figures for those with children are lower).
Housing
Amount and type of housing
According to the 2011 Census there were 12,490 dwellings within the National Park boundary. Broken down by type this was:
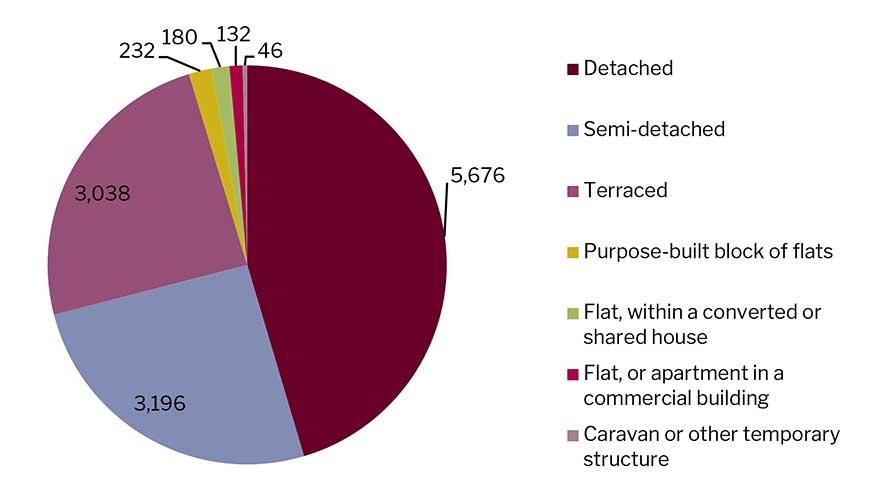
Comparable data from the 2021 Census is not available. However, a more recent estimate of the total housing stock in the National Park is available from the Authority’s housing needs assessment, with an estimate of 12, 423 dwellings, which aligns closely with the total figure from the 2011 Census.
Second homes
Not all residential properties are occupied as permanent homes. Approximately 17% of all households were recorded in the 2011 census as ‘household spaces with no usual residents’ in other words they are either vacant homes, or second homes or holiday homes (vacancies are in reality likely to be a very minor component of this figure). Figures from the 2021 Census are not available. Updated information from Council Tax records is being sought from North Yorkshire Council and will be incorporated into future versions of this report.
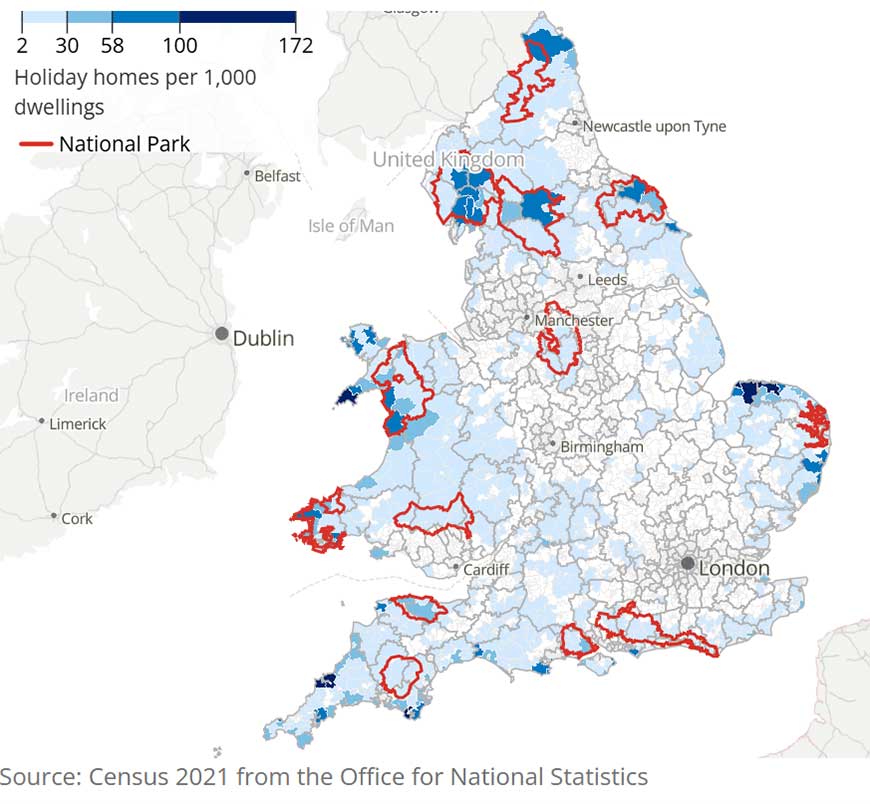
The relative significance of the National Park, in regional and national terms, as a location for second homes is illustrated by the following map:
Housing Tenure
The following table shows what the 2021 Census is telling us about how we pay for our homes. It also compares the position in the National Park relative to that in 2011. It illustrates that there has been an increase in outright ownership, social renting, and other unspecified forms of renting, with a decrease in rental via a private landlord or agency. Outright ownership very substantially exceeds the national and regional rate and rental via the local authority is very substantially less. We could assume that our older population (compared to national and regional trends) means more homes are not only owned by the occupiers, but many people own outright - over the years been able to pay their mortgage off or inherited a home. Half the households in the National Park own their properties outright compared to approximately one third in England or Yorkshire and the Humber.
| Tenure | England 2021 | Yorkshire and Humber 2021 | North York Moors 2011 | North York Moors 2021 |
|---|---|---|---|---|
| Owned outright | 32.5% | 32.1% | 47.7% | 50.6% |
| Owned with a mortgage or loan | 28.8% | 28.9% | 24.8% | 20.7% |
| Shared ownership (part owned and part rented) | 1.0% | 0.5% | 0.5% | 0.9% |
| Rented from council (Local Authority) | 8.3% | 11.0% | 1.8% | 1.6% |
| Social Rented - Other | 8.8% | 6.2% | 6.3% | 7.3% |
| Rented - Private landlord or letting agency | 18.2% | 14.4% | 17.2% | 14.6% |
| Rented - Other | 2.2% | 1.5% | 2.3% | 4.4% |
| Living rent free | 0.1% | 1.5% | 0.2% | 0.1% |
Table 7 Housing tenure spatial comparison (2021) (ONS)
House Prices
ONS data indicates that the median house price in the National Park for the year ending September 2025 was £342,800. This is a substantial increase on the equivalent figure for September 2020 of £249,975. Because of the low sample sizes some care needs to be taken when interpreting this data – additional sales of high value properties can skew the data.
However, it is also important to consider house price affordability, in the context of earnings. Median earnings in the National Park in 2025 were £40,400 for males and £32,000 for females. (Source: Natural England PLTOF data). In England in 2025 the median earnings were £42,400 for males and £35,700 for females. The working population in the National Park therefore earns less than the median for England. Males earn 21% more than females in the National Park compared to 15% in England as a whole (based on median income).
The ratios of median property purchase prices to median residence-based earnings in the National Park from 2021/22 to 2023/24 were (Source: Natural England PLTOF data):
| Year | Ratio of median purchase price to median residence based earnings (National Park) | Ratio of median purchase price to median residence based earnings (England) | Ratio of lower quartile purchase price to median to lower quartile residence based earnings (National Park) | Ratio of lower quartile purchase price to median to lower quartile residence based earnings (England) |
|---|---|---|---|---|
| 2021/2 | 7.2 | 7.6 | 6.8 | 6.8 |
| 2022/3 | 7.9 | 8.5 | 7.5 | 7.5 |
| 2023/4 | 7.8 | 8.3 | 7.6 | 7.7 |
Table 8 Property prices relative to earnings 2020/1-2023/4
Median and lower-quartile housing affordability therefore improved slightly from 2021/22 to 2023/24, in both the National Park and England as a whole. For median purchase prices and earnings, National Park housing is slightly more affordable than England as a whole, whereas for lower quartile purchase prices and earning, the National Park is very similar to England.
From 2024/25, no overall property purchase price ratios are available and the data is instead split into property type (detached, semi-detached, terraced and flats/maisonettes). Median affordability ratios are as follows:
| 2024/25 | Ratio of median purchase price to median to residence based earnings (National Park) | Ratio of median purchase price to median to residence based earnings (England) | Ratio of lower quartile purchase price to median to lower quartile residence based earnings (National Park) | Ratio of lower quartile purchase price to median to lower quartile residence based earnings (England) |
|---|---|---|---|---|
| Detached | 10.6 | 10.8 | 10.9 | 10.9 |
| Semi-detached | 6.6 | 7.1 | 7.1 | 7.0 |
| Terraced | 5.5 | 6.3 | 5.6 | 5.6 |
| Flats/maisonettes | 4.1 | 6.3 | 4.0 | 5.3 |
Table 9 - Property prices relative to earnings 2024/5
For lower quartile purchase prices and earnings, National Park housing has similar affordability ratios to England, except for flats/maisonettes which are more affordable in the National Park.
Key issues from the baseline:
- Over 30% of all households are one person households – this percentage has been rising slowly since 2001. This figure is nevertheless slightly below the national average;
- Compared to national and regional rates we have more households with no children;
- Despite population decline the number of households has increased slightly – this is because households are getting smaller in size;
- Although there was an approximate 7% increase in housing stock between 2001 and 2011, since then the stock has remained relatively stable. There is a high proportion of homes in second ownership.
- Just over half of households own their house outright (with no mortgage) compared to around one-third nationally. This may largely reflect an older population. The proportion of homes owned outright has been increasing. Social renting has increased slightly whilst private renting has decreased;
- House prices remain high -in the year to September 2026 the median house price in the National Park was £342,800, although in relative terms there has been a small improvement in affordability in recent years.
Community facilities and services
The Authority carries out a Community Facilities survey on a regular basis – surveys were carried out in 1989, 1995, 2003, 2006, 2009, 2015, 2018 and 2025. Surveys are sent to Parish Councils.
In 2025, of the 84 settlements surveyed (including Guisborough):
- 24% had a general store
- 19% had a post office (does not include mobile services)
- 74% had a public house
- 76% had a village or other public hall
- 35% had a children’s play area
We cannot precisely compare the results of each survey over time given that different respondents may interpret the definition of a facility differently (for example some may include mobile facilities), and the methodology may have changed over time. Villages may also have more than one facility, so a loss may not be recorded. Since 2009 the settlements are based upon those listed in the settlement hierarchy contained in the 2008 Core Strategy which differs slightly from the previous years when those villages listed in the 2003 Local Plan were used.
Looking specifically at 2015, 2018 and 2025 (where the same methodology has been used), the most notable trend is the relative stability of community facilities such as pubs and village halls, compared with the gradual decline in commercial services.
The number of villages with a pub was unchanged, at 61 in both 2015 and 2025. This does not mean that no pubs have closed or opened. A change will not have been recorded when a village has more than one pub and one closed - for example, the Milburn Arms at Rosedale Abbey which closed in 2018, the Fox and Hounds at Goldsborough in 2018 and the Grapes Inn at Easington (2016). All three villages have other pubs.
Hall provision was similarly stable but with a small net increase, rising from 62 to 64 villages.
By contrast, general stores declined from 23 to 20 villages, while post offices fell from 19 to 16 villages. The post-office figure is particularly notable because it first rose sharply to 26 villages in 2018 before falling to its lowest level of the three years in 2025. As part of the 2015 survey, the villages of Lealholm, Mickleby and Sawdon all lost their Post Office, (the latter losing the Post Office in Brompton). Some villages now have a mobile service.
Play areas occupy an intermediate position. Their number rose from 30 to 32 villages between 2015 and 2018, before falling to 29 in 2025. Thus, there has been only a small net decline over the full period.
Taken together, the data suggests that since village community infrastructure has been more resilient than traditional commercial and postal services. Pubs and halls have remained available in roughly the same number of villages, whereas general stores and permanent post offices have become less widespread. The changes are therefore less about the complete disappearance of facilities from villages and more about a gradual reduction in the number of villages able to retain certain traditional services.
Access, Recreation & Leisure
There are around 2,200 km of public rights of way in the National Park. In surveys carried out in 2025, 87% of rights of way on promoted routes were graded 'easy to use' (up from 78% in 2014). 78% of other rights of way were graded 'easy to use'. In addition, there are areas owned by the Forestry Commission, National Trust and National Park Authority, together with areas specified in management agreements, where users are permitted access. 77 km of the Coast to Coast Path National Trail passes through the National Park. The King Charles III England Coast Path covers 44.3 km in the National Park and the entire path was formally inaugurated in March 2026.
Please note that National Trails contain public rights of way, so there is an overlap with the Public Rights of Way figures given above.
The requirements of the Countryside and Rights of Way Act 2000 give people the right to walk across upland areas that were previously closed to the public; this has led to approximately 45% of the land in the National Park being designated for Open Access.
The Rights of Way network is also an important provision for a range of users such as horse riders and cyclists where they have a legal right to use bridleways. Over 36km of public rights of way are promoted as suitable for use by disabled people. Off-road vehicle users, such as trail riders and four wheel drive vehicles, are increasingly exercising their right to use unsurfaced, unmetalled roads. Increased use of green lanes by vehicles has resulted in considerable damage to the surface of tracks in particular locations.
Key issues from the baseline:.
- There has been a loss of some community facilities in villages over the past decade or so and a particular decline in the number of villages with a post office or general store.
- There has been an increase in the number of rights of way classed as easy to use since 2014 and a recent increase in the length of formally recognised National Trails within the National Park.
Traffic, Transport and Accessibility
Objective S4. To make sure new development is easily accessible to essential services, to help reduce the need to travel and minimise the environmental impact of transport.
Vehicle transport in the North York Moors National Park while comparatively modest in volume compared to other areas does provide a lifeline for many living and working in the National Park and remains the main option for those wanting to enjoy the National Park’s special qualities. Specific data on traffic flows in the National Park are limited.
The Department for Transport (DfT) maintains a database of Annual Average Daily Flow (AADF) flows recorded on major highway links throughout the United Kingdom. AADF represents the number of vehicles estimated to pass a given point on the road during a 24-hour period on an average day of the year. The DfT database has now been updated to include figures through 2025. Traffic levels at monitored locations within and around the North York Moors generally show static growth since 2006, although substantial temporary reductions occurred during 2020 as a result of Covid-19 travel restrictions. Subsequent years saw a strong recovery, with some locations now carrying significantly higher traffic volumes than before the pandemic.
The exception is the A171 south of Newholme, near Whitby, where the AADF increased from 13,570 vehicles per day in 2018 to 16,891 vehicles per day in 2025, representing growth of approximately 24.5%. Traffic levels fell sharply during 2020 but subsequently recovered and exceeded pre-pandemic levels by 2022.
Nationally, DfT statistics show that motor vehicle traffic in Great Britain in 2025 was above pre-pandemic 2019 levels, indicating that the recovery observed at local North Yorkshire locations reflects wider national trends.
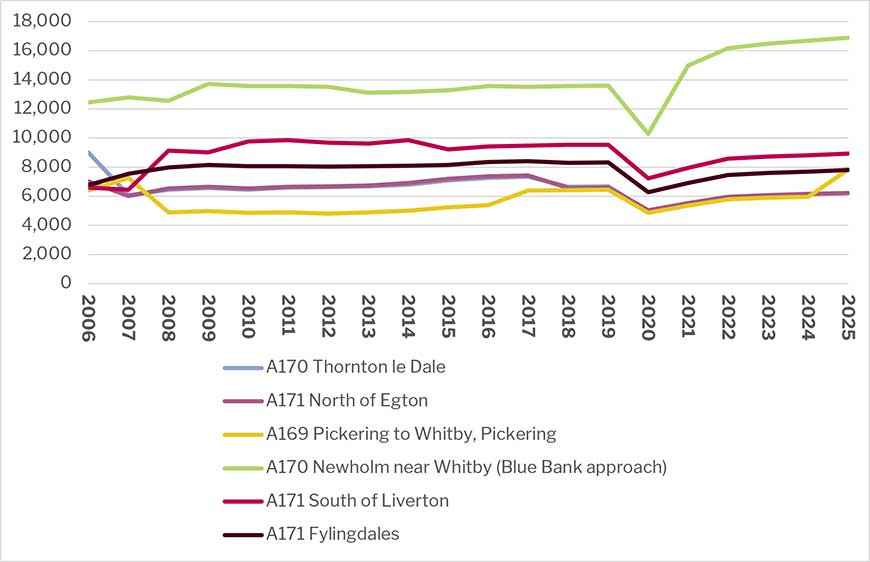
The majority of the vehicles counted on an average day of the year were cars and taxis, averaging 79% for the years recorded (manual counts and estimates).
The number of vehicles counted on an average day of the year therefore appears to have increased significantly over the past two decades. However, the limited data available means that any conclusions should be treated with caution.
Increasing traffic levels may indicate that more people are coming in or passing through the North York Moors to enjoy its special qualities. Alternatively, it can also indicate increased pressure on infrastructure and on special qualities such as tranquillity.
Emissions from transport are also an important sustainability consideration. Greenhouse gas emissions estimates for the National Park show that:
- Road transport (A roads) emissions decreased from 49.6 ktCO2e in 2005 to 37.5 ktCO2e in 2024 (-25%)
- Road transport (minor roads) emissions decreased from 67.2 ktCO2e in 2005 to 57.6 ktCO2e in 2024 (-14%)
- Other transport emissions (excluding diesel railways) increased from 1.6 ktCO2e in 2005 to 4.8 ktCO2e in 2024 (+206%).
- This suggests that increases in traffic flows are being partially offset by improvements in vehicle efficiency and reductions in emissions across the road transport sector.
Household car ownership
The following table compares household car ownership for the National Park and Yorkshire and Humber region (Source ONS Census 2021). Comparable data from the 2011 Census is not available. The data shows that the National Park has a substantially smaller proportion of households without access to a car or van and a higher proportion of households with access to multiple vehicles. This helps to indicate the relative dependency of the National Park on this mode of travel and is, in turn, likely to reflect the highly rural and sparsely populated nature of the area and a relative absence of public transport opportunities.
| Household car ownership | National Park 2021 | Yorkshire and Humber 2021 |
|---|---|---|
| % of households with no cars or vans | 10.1 | 24.2 |
| % of households with 1 car or van | 40.2 | 42.1 |
| % of households with 2 cars or vans | 33.6 | 25.7 |
| % of households with 3 or more cars or vans | 16.0 | 8.0 |
Table 11 Extent of car ownership, National Park and YH Region comparison 2021 (ONS)
The 2021 Census also provides information on the distance travelled to work by those in employment within the National Park. There is an important caveat with this data in that the Census took place within the period affected by the Covid 19 pandemic, when there was significant disruption to working patterns. The data shows that around a third of the working population worked mainly from home, with only a relatively small proportion travelling more than 20km. More data is needed to identify whether this pattern continues.
Distance travelled to place of employment
| Distance travelled to place of employment | Proportion of all residents in employment the week before the Census |
|---|---|
| Less than 2km | 4.7% |
| 2km to less than 5km | 5.2% |
| 5km to less than 10km | 8.2% |
| 10km to less than 20km | 12.3% |
| 20km to less than 30km | 7.5% |
| 30km to less than 40km | 4.9% |
| 40km to less than 60km | 3.3% |
| 60km and over | 2.6% |
| Work mainly from home | 34.7% |
| Work mainly at an offshore installation, at no fixed place, or outside the UK | 16.5% |
Table 12 Distance to work travelled by employed National Park residents 2021 (ONS)
Key messages from the baseline:
- Traffic levels in the National Park appear to have increased but data is limited;
- Car ownership levels are above the regional rate and the car is by far the most used mode of transport;
- There appears to be a relatively high proportion of home working within the National Park but again data is limited.
Economic Issues
We have identified the following economic objectives for testing purposes:
Objective EC1. To strengthen and diversify the local economy by supporting a range of opportunities for employment and training particularly in sustainable locations.
Objective EC2. To support the tourism and recreation industry by ensuring that development contributes to the local economy in a manner compatible with National Park purposes and protect or enhances opportunities for understanding and enjoying the National Park’s special qualities.
Economy and Employment
The table below summarises information from the 2021 Census on economic activity rates in the National Park. The equivalent proportions for England as a whole are also shown for comparison. The data shows that the National Park has a lower proportion of population who are economically active, particularly those in full time employment. Conversely, the National Park has a higher proportion of the population engaged in full or part time self-employment. The relatively high proportion of the population who are not economically active is accounted for mainly by those in retirement.
Economic Activity Status | Total | % 2021 | % 2011 |
|---|---|---|---|
| Total population aged 16 or over | 19,978 | - | - |
| Economically active (excluding full time students) | 10,206 | 51.1% | 58.6% |
| Economically active, in employment full time (excluding full time students) | 4,463 | 22.3% | 34.3% |
| Economically active, in employment part time (excluding full time students) | 2,202 | 11% | 11.9% |
| Economically active, self-employed full time (excluding full time students) | 2,109 | 10.5% | 5.7% |
| Economically active, self-employed part time (excluding full time students) | 1,199 | 6.1% | 3.9% |
| Economically active, unemployed (excluding full time students) | 231 | 1.2% | 2.9% |
| Economically active, student (full time) | 263 | 1.3% | 2.3% |
| Economically active, student full time and in employment | 216 | 1.1% | 1.7% |
| Economically active, student full time (unemployed) | 47 | 0.2% | 0.6% |
| Economically inactive | 9,509 | 47.6% | 39.1% |
| Economically inactive (retired) | 6,925 | 34.7% | 21.5% |
| Economically inactive (student) | 721 | 3.6% | 5.6% |
| Economically inactive, looking after home or family | 780 | 3.9% | 4.8% |
| Economically inactive, long term sick or disabled | 586 | 2.9% | 4.1% |
| Economically inactive, other | 497 | 2.5% | 3.1% |
Table 13 National Park population economic activity rates 2021 (ONS)
Notwithstanding the above data, it should be noted that working out exactly how many jobs and workers there are in the National Park is problematic and any figures therefore need to be treated with a degree of caution. This is because:
- We do not have data which corresponds to the exact National Park boundaries. It is usually only available at district and ward level only;
- Employment data is provided through survey results meaning that for lower level geographies there may be sampling errors which can affect data – this is particularly the case in areas of low population, such as the North York Moors;
- Different estimates can include or exclude different types of jobs – for example, some surveys (for example the BRES (the ONS Business Register and Employment Survey)) figures do not include the self-employed or agricultural workers, which are common in the National Park;
- Jobs can be full time or part time or measured as full time equivalents. People can also have more than one job. How job data is compiled may differ between datasets;
- People do not stay still - not all economically active people will work in the National Park – some will commute out whilst others commute in. Nevertheless, the data presented earlier in the Traffic, Transport and Accessibility section suggests that travel to work distances are relatively short, with a high proportion of home working, suggesting that the proportion of the workforce commuting to employment outside the National Park is relatively small.
Unemployment
Unemployment data for the National Park in November 2025 shows an unemployment rate of 1.6% compared to the England rate of 4.06%. 17.26% of the population were claiming benefits compared to 23.59% for England. (Source: NYC Local Insight dashboard.) Low unemployment is likely due to a high proportion of retired people and limited local labour availability.
Comparable data from the last version of this report shows that the unemployment rate in the National Park as at February 2016 was relatively low at around 0.7%. This compares to 1.7% in September 2009. These figures suggest that the rate fluctuates but remains relatively low. Such a low unemployment rate may constrain labour supply availability for future economic growth.
Employment by sector
Employment in the National Park by sector, for 2021, is summarised in the following chart:
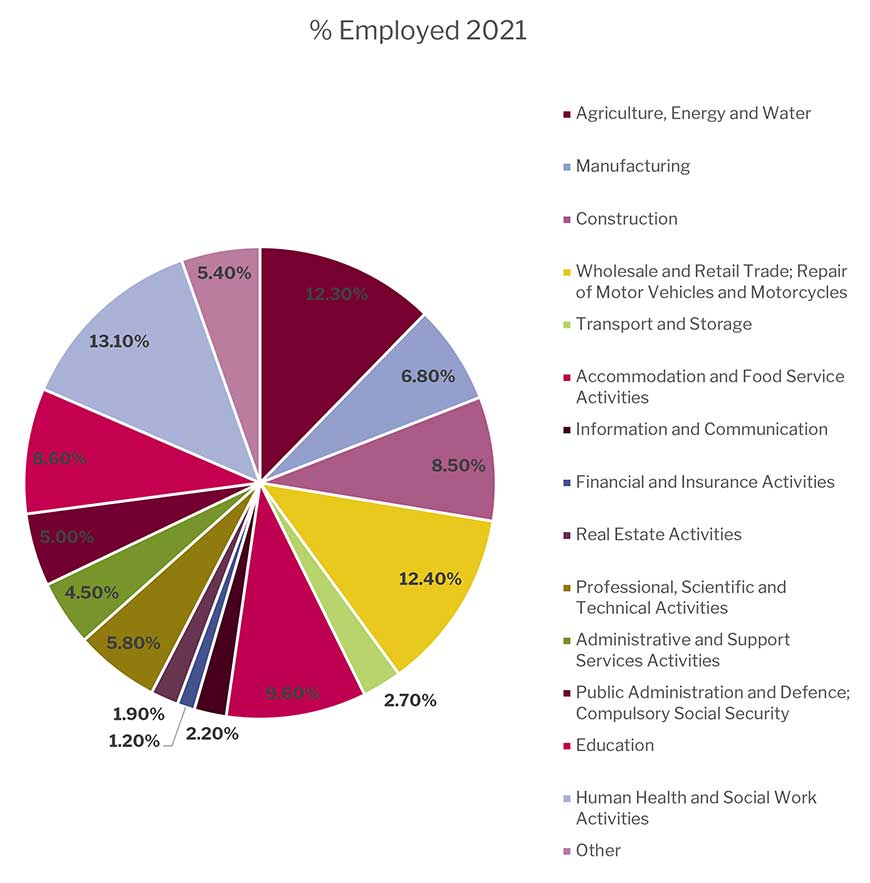
The National Park’s employment profile unsurprisingly shows a relatively high dependence on jobs likely to be catering to demand from tourists, namely wholesale and retail jobs and accommodation and food services. Employment in human health, social work and education is also relatively common. Changes to categories mean it is difficult to compare the figures directly with those from the 2011 Census but the overall picture appears to have remained broadly the same.
Businesses operating in the National Park
Guidance suggests using the Business Register and Employment Survey to access information. This is not cut to National Park boundaries, however DEFRA use a ‘best fit’ methodology to provide information for National Statistics using output areas. The resultant data do not perfectly represent the Protected Landscape and therefore should be treated as estimates.
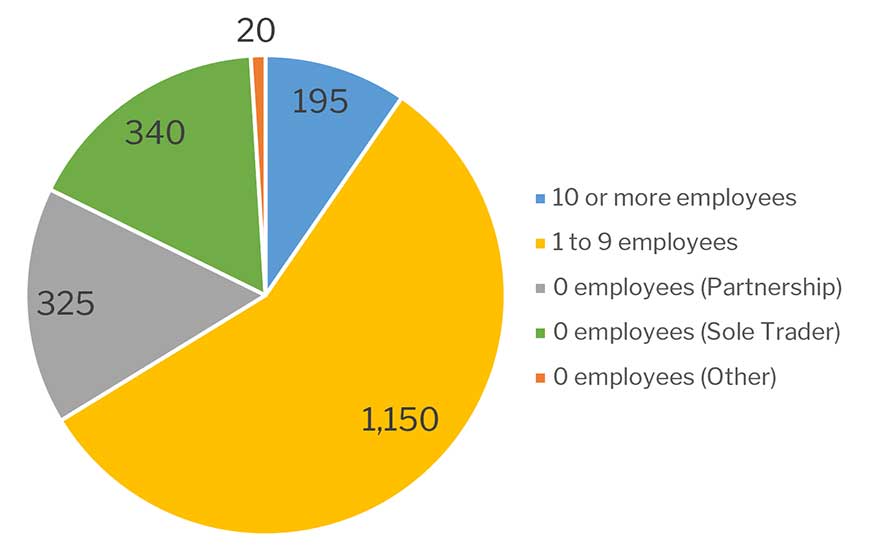
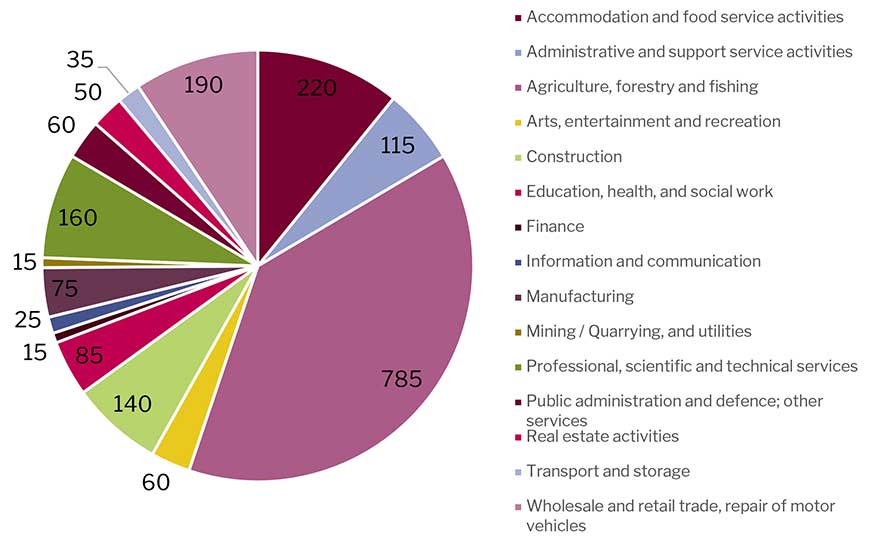
At the end of 2024 there were around 2,030 businesses in the National Park. This is a decrease from 2021/22, when there were a total of 2,235 businesses. The reason for this decrease is not known. Sizes of businesses registered at the end of 2024 were:
These businesses were operating across the following sectors in 2024:
Household income
Median earnings in the National Park in 2025 (Source: National England PLTOF statistics) were £40,400 for males and £32,000 for females. In England in 2025 the median earnings were £42,400 for males and £35,700 for females. The working population in the National Park therefore earns less than the median for England. Males earn 21% more than females in the National Park compared to 15% in England as a whole (based on median income).
Output
It has been estimated that in 2013 business in the North York Moors had a combined turnover of £428 million per year leading to a Gross Value Added figure of £256 million (based on applying level of County Rates) (Source: Inter-Departmental Business Register data quoted in Cumulus Consultants Ltd and ICF GHK for National Parks England “Valuing England’s National Parks’, May 2013.) Although now somewhat dated, the Prosperity and Protection – The Economic Impact of National Parks in the Yorkshire and Humber Region (Council for National Parks, 2006) - concluded that the designation as a National Park has a positive effect on the economy of the National Park. It states that, based upon the surveys undertaken, businesses in the region’s National Parks (North York Moors and Yorkshire Dales) support over 34,000 jobs and support £576 million of GVA.
Agriculture
Information on the type and size of agricultural holdings over time is available from the Department for the Environment, Farming and Rural Affairs (DEFRA). It is available for the years 2009-2025.
The number of agricultural holdings is down from 1,087 in 2009 to 935 in 2025 (a 14% decrease (it has fallen by 4.9% since 2021). The total number of agricultural workers has fallen by 10.7% and 7.2% over the same period and full time regular workers has fallen by 45.8% and 11.6% respectively. We have some information on farming from the 1974 National Park Plan which reported the total number employed in agriculture as 4,418 in 1951, 3,345 in 1965 and 2,447 in 1974. In 2025 there were 1,916 people employed in farming.
The hectarage of permanent grassland on farms is up by 21.9% to 46,158 hectares in 2025 and farm woodland is up 62.8% to 4726 hectares.
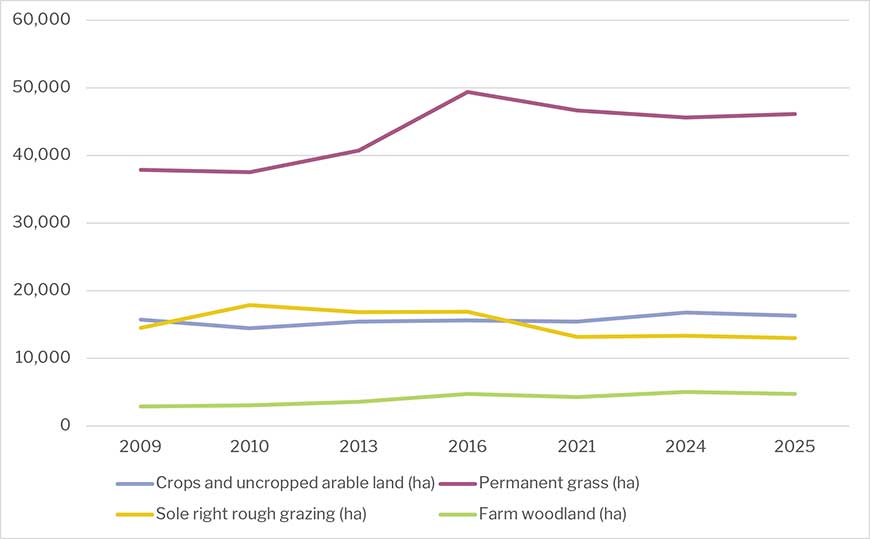
With the exception of the number of pigs (which has seen an increase of 23.9% between 2009 – 2025), all other livestock numbers have fallen. Numbers of dairy cattle are down by 43.7%, beef cattle by 23.8%, sheep by 15.1%, and poultry by 53.8%.
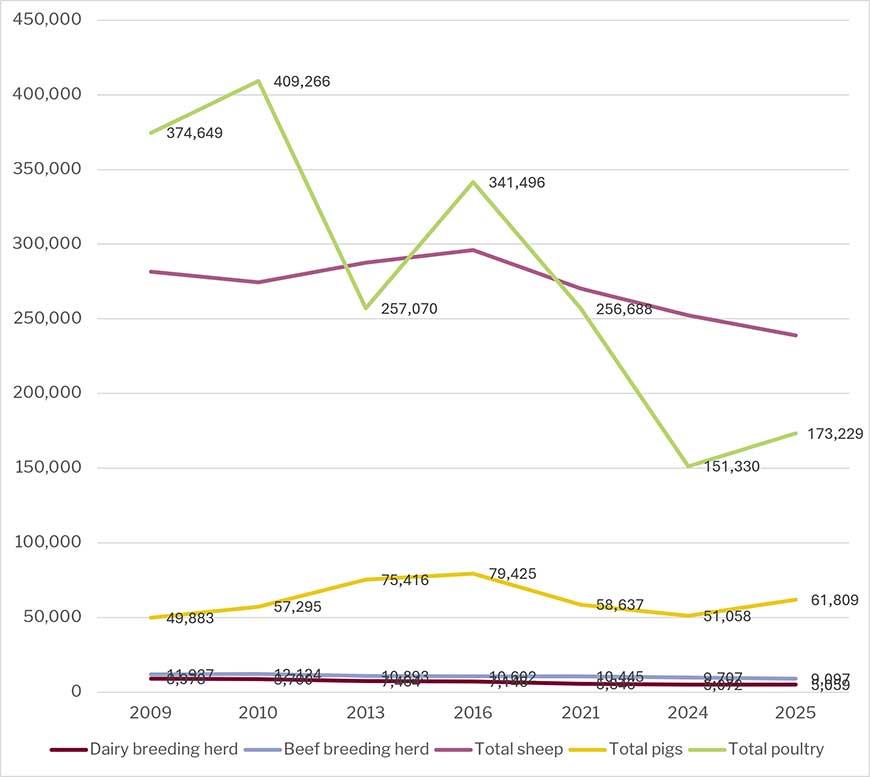
Tourism Economy
Tourism is a fundamental component of the National Park economy.
The Scarborough Tourism Economic Activity Monitor (STEAM) report for 2025 provides annual estimates for tourism trends. In 2025 there were:
- A total of £1.13 billion was generated directly and indirectly within the local economy through visitor and tourism business expenditure, an increase of 2.2% on 2024.
- 9.8 million tourism visits to the North York Moors National Park
- 15 million visitor days and nights generated by visitors, an increase of 4.6% on 2024.
- 7.9 million tourism visits made by day visitors
- Day visits to the North York Moors National Park generated £425 million for the local economy
- 1.9 million visits were made by visitors staying within the area as part of a holiday or short break, generating 7.1 million nights in local accommodation
- In total, staying visitors generate an economic impact of £705 million for local businesses and communities
- On average, visitors staying in the North York Moors spend 3.7 nights in the area and spend a total of £197 million on local accommodation
- Visitor activity and spend supports more than 11,510 full time equivalent jobs locally
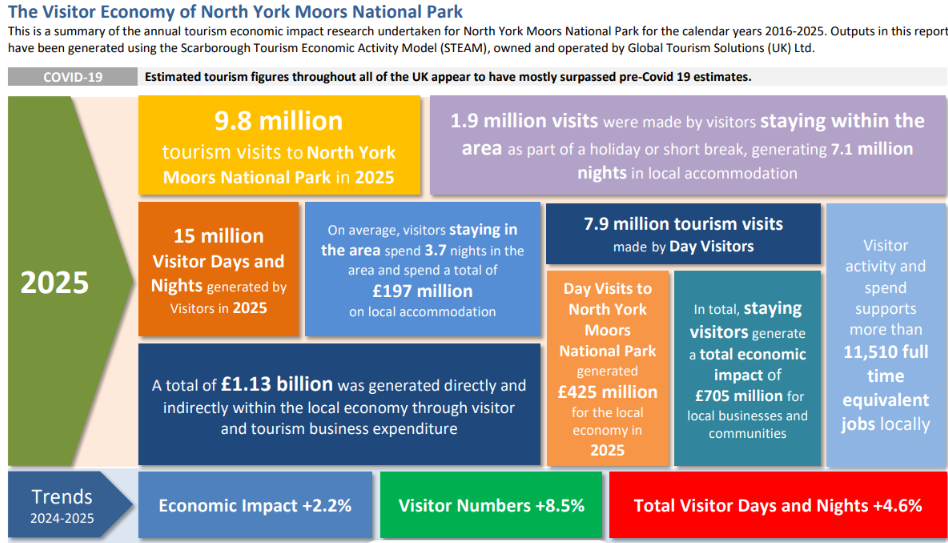
Education, Skills and Training
There are no secondary schools in the National Park. The main secondary (ages 11-18) schools serving the National Park are Lady Lumley's School at Pickering, with 676 pupils at July 2026 and Ryedale School at Nawton (698 pupils). Other secondary schools closest to the National Park Boundary are Laurence Jackson School at Guisborough (1247 pupils), Scalby Academy (980), St Augustines, Scarborough (604) Scarborough University Technical College at Scarborough (275), Whitby School (975) and George Pindar Schools at Eastfield, Scarborough. (730).
Primary schools represent the only educational facilities of the National Park. In total 24 settlements in the National Park have a school, which equates to almost a third of settlements (31%). Children above primary school age (key stage 2) move onto schools located outside the National Park and the majority attend schools in Scarborough, Whitby, Guisborough, Pickering, Northallerton and Stokesley.
According to data from the Department for Education, a number of schools are operating significantly below capacity. 7 schools, at Chop Gate, Glaisdale, Goathland and Hawsker, Ingleby Greenhow, Rosedale and Egton are running at below half capacity.
| - | Schools | Age Range | Net Capacity | Number on Roll (Jan 25) | % Capacity 2025 | % Capacity 2017 |
|---|---|---|---|---|---|---|
| 1 | St Benedict's Catholic Primary School Ampleforth | 3 to 11 | 105 | 66 | 63% | 81% |
| 3 | Bilsdale Midcable Chop Gate CE VC Primary | 4 to 11 | 42 | 9 | 21% | 31% |
| 4 | Carlton and Faceby CE VA Primary | 4 to 11 | 50 | 51 | 102% | 88% |
| 5 | Castleton CP | 4 to 11 | 56 | 48 | 86% | 66% |
| 6 | Danby CE VC | 4 to 11 | 70 | 46 | 66% | 56% |
| 7 | East Ayton CP | 4 to 11 | 210 | 194 | 92% | 97% |
| 8 | Egton CE VA Primary | 4 to 11 | 56 | 41 | 73% | 95% |
| 9 | Fylingdales CE VC Primary | 4 to 11 | 104 | 60 | 58% | 72% |
| 10 | Glaisdale Primary | 4 to 11 | 56 | 24 | 43% | 71% |
| 11 | Goathland Primary | 4 to 11 | 49 | 23 | 47% | 47% |
| 12 | Hackness CE VC Primary | 4 to 11 | 56 | 55 | 98% | 68% |
| 13 | Hawsker cum Stainsacre CE VC Primary | 4 to 11 | 84 | 46 | 55% | 68% |
| 14 | Helmsley CP | 3 to 11 | 168 | 163 | 97% | 63% |
| 15 | Ingleby Greenhow CE VC Primary | 4 to 11 | 70 | 31 | 44% | 57% |
| 16 | Lealholm Primary | 4 to 11 | 56 | 36 | 64% | 52% |
| 17 | Lythe CE VC Primary | 3 to 11 | 105 | 75 | 71% | 73% |
| 18 | Oakridge CP, Hinderwell | 3 to 11 | 56 | 31 | 55% | 80% |
| 19 | Osmotherley Primary School | 4 to 11 | 70 | 40 | 57% | 60% |
| 20 | Rosedale Abbey CP | 4 to 11 | 52 | 14 | 27% | 25% |
| 21 | Sinnington CP | 4 to 11 | 84 | 106 | 126% | 81% |
| 22 | St. Hedda's RC Primary, Egton Bridge | 4 to 11 | 51 | 16 | 31% | 53% |
| 23 | Staithes, Seton CP | 3 to 11 | 105 | 61 | 58% | 77% |
| 24 | Thornton le Dale CE VC Primary | 4 to 11 | 143 | 137 | 96% | 106% |
| - | TOTAL | - | 1898 | 1373 |
Table 15 School capacity and numbers on the school roll
Historical data for the National Park area is also available from the Protected Landscape Targets and Outcomes data releases. From 2020/21 to 2022/23 the proportion of National Park school capacity reached was:
67% in 2020/21 (88% for England)
68% in 2021/22 (89% for England)
70% in 2022/23 (89% for England)
69% in 2023/24 (89% for England)
The proportion of school capacity utilised in the National Park therefore increased slightly from 2020/21 to 2022/23, although it remained below that of England as a whole.
Qualifications
2021 Census data indicates that the population of the National Park is relatively well qualified. Although, in 2021, 16% of the population had no qualifications, this is less than the national average. 37% of the population had gained an NVQ level 4 or above (certificate, diploma or degree) compared to 34% nationally. The Table below shows the breakdown of qualification levels for the National Park and England, for residents over the age of 16.
| Highest Level of Qualification | % North York Moors National Park | % England |
|---|---|---|
| No qualifications | 15.9% | 18.1% |
| Level 1 and entry level qualifications | 8.4% | 9.7% |
| Level 2 qualifications | 13.2% | 13.3% |
| Apprenticeship | 7.0% | 5.3% |
| Level 3 qualifications | 15.8% | 16.9% |
| Level 4 qualifications or above | 37.3% | 33.9% |
| Other qualifications | 2.4% | 2.8% |
Table 16 Qualifications held by National Park residents 2021 (ONS)
Whilst educational standards within the area are relatively high, retention of skills in the area is a concern given the trend of outward migration of young people from the National Park. In addition, the loss of key skills that contribute to the local distinctiveness of the area is another potential pressure on the National Park.
Health and social care
There are five GP surgeries within the National Park (The Esk Valley Medical Practice at Danby and Egton, Staithes, Helmsley, and the Whitby Group practice at Robin Hood's Bay.) GP surgeries are just over the National Park boundary at Sleights and Ampleforth, and Guisborough, Kirkbymoorside, Whitby, Great Ayton and Stokesley also contain nearby surgeries.
The British Medical Association have an aspirational target of 1 GP to 1,000 patients and the national figure is 1 GP to 2,270 patients. All identified GP practices serving the National Park record patient-to-GP ratios below the national average and within the BMA aspirational benchmark. Figures are from NHS England Digital.
| Practice Name | Settlement | Relation to Park | Registered Patients (list size) | FTE GPs (all incl. trainees & locums) | Patients per FTE GP (all) |
|---|---|---|---|---|---|
| Helmsley Surgery | Helmsley | Within park | 3,589 | 1.78 | 2,016 |
| Kirkbymoorside Surgery | Kirkbymoorside | Within park | 6,168 | 4.93 | 1,251 |
| Pickering Medical Practice | Pickering | Within / adjoins park | 10,795 | 7.74 | 1,395 |
| Esk Valley Medical Practice | Danby / Egton | Within park | 5,124 | 3.57 | 1,435 |
| Sleights and Sandsend Medical Practice | Sleights | Within / adjoins park | 5,310 | 5.67 | 937 |
| Staithes Surgery | Staithes | Adjoins park (coastal fringe) | 3,060 | 2.84 | 1,077 |
| Whitby Group Practice | Whitby | Adjoins park | 13,256 | 9.34 | 1,419 |
| Great Ayton Surgery | Great Ayton | Adjoins park (northern boundary) | 5,655 | 6.99 | 809 |
| Stokesley Surgery | Stokesley | Adjoins park (northern boundary) | 9,530 | 7.31 | 1,304 |
| Ampleforth Surgery | Ampleforth | Adjoins park (southern boundary) | 4,141 | 4.81 | 861 |
| Terrington Surgery | Terrington | Adjoins park (southern boundary) | 1,868 | 0.89 | 2,099 |
| TOTAL (11 practices) | - | - | 68,496 | 55.87 | 1,226 |
Table 17 General Surgeries, Registered Patients, Full Time GPs, Patients per GP.
There is one NHS dentist within the National Park boundary (Robin Hood's Bay), plus just over the edge of the National Park boundary at Helmsley.
Key issues from the baseline:
- Compared with the national position, the National Park has a lower proportion of population who are economically active, particularly those in full time employment. Conversely, the National Park has a higher proportion of population engaged in full or part time self-employment. The relatively high proportion of the population who are economically inactive is accounted for mainly by those in retirement;
- There is a very low unemployment rate, meaning there is virtually no available labour to fill any new jobs in the National Park;
- The employment profile shows a relatively high dependence on jobs likely to be catering to demand from tourists, namely wholesale and retail jobs and accommodation and food services. Employment in human health, social work and education is also relatively common;
- Only a small proportion of businesses in the National Park have 10 or more employees, making the area economically more reliant on the success of small businesses;
- The area receives a very high number of visitors and tourism is accordingly very important to the economy of the National Park;
- The population of the National Park is better qualified than other areas, however there is a loss of younger qualified people from the North York Moors;
- Notwithstanding the well-qualified workforce, median incomes in the National Park are below the average for England.
Are there any existing environmental problems that are relevant to the plan, or were there any difficulties when compiling the required information?
No major adverse environmental issues have been identified in this initial baseline information although a number of issues identified that are likely to give rise to a need for an appropriate policy response in the Local Plan. This will help ensure that National Park statutory purposes and the National Park’s special qualities are supported and furthered as appropriate.
Although a relatively comprehensive and up to date baseline is available to support Sustainability Appraisal of the Local Plan, a number of more minor data issues have been identified in this document and which will need to be addressed where possible in future iterations of the Appraisal. One potentially significant issue is that the 2021 Census provides data from a time when there was significant disruption to society as a result of the Covid19 pandemic. This further indicates a need to seek updated data on relevant matters as work on the Local Plan takes place.
Last updated: 12 Oct 2026